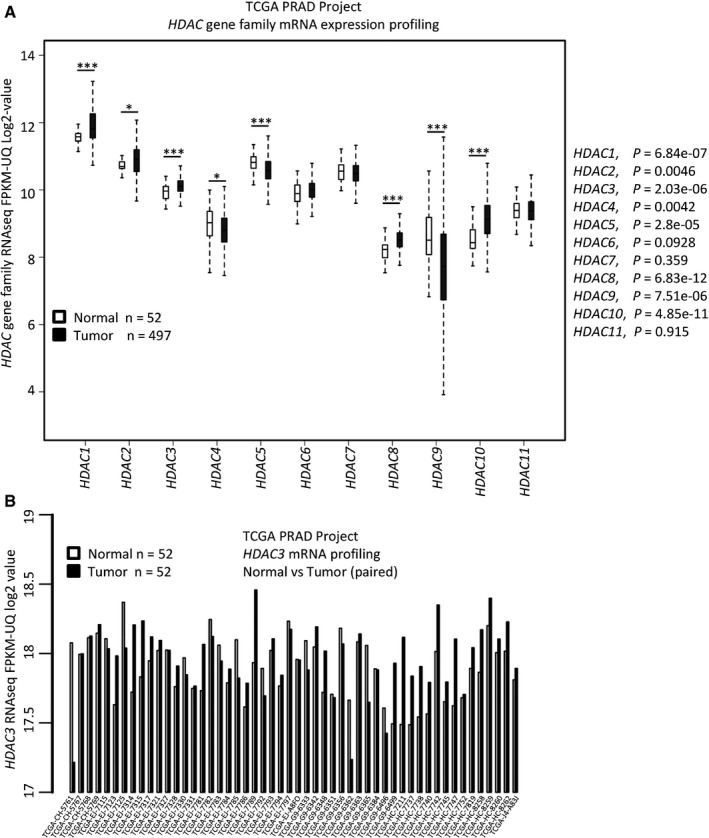
Figure EV1. HDAC3 is overexpressed in prostate cancer patient specimens.

- The mRNA level of 11 HDAC gene family members was compared between normal and tumor tissues (the mRNA expression data were extracted from the TCGA project). P‐values were performed between normal tissues (n = 52) with tumor tissues (n = 497) for each gene by Wilcoxon rank sum test with continuity correction and shown alongside the graph. The description for box plot is the same as the figure legend in Fig 7H.
- The mRNA level of HDAC3 gene was compared between paired normal and cancer tissues for individual patient. Normal/tumor paired samples were available only in 52 patients in the TCGA cohort.
