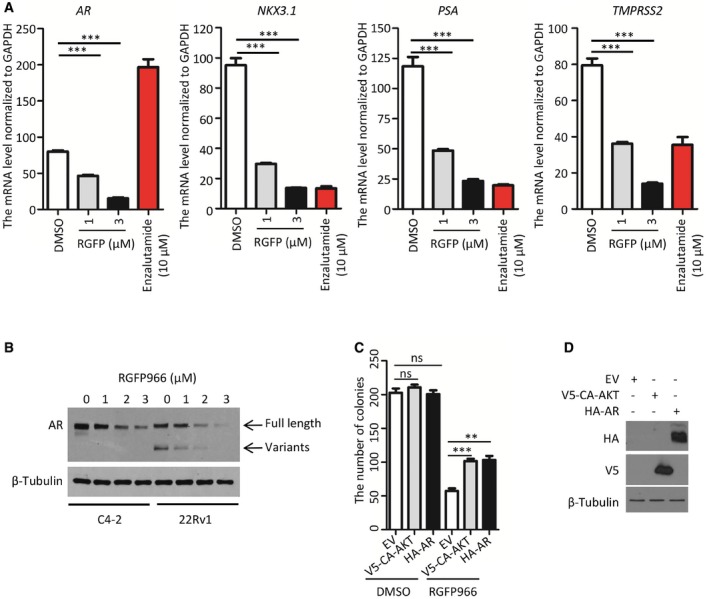
Figure EV5. The sensitivity to HDAC3 inhibitor is dependent on the status of AKT and AR .

-
AC4‐2 cells were treated with vehicle (DMSO); different concentrations of HDAC3 inhibitor RGFP966 or the antiandrogen enzalutamide (positive control) for 24 h and cells were harvested for RT–qPCR analysis of mRNA levels of AR and its downstream target genes (NKX3.1, PSA, and TMPRSS2). The RT–qPCR was performed in triplicate for each sample. Data represents means ± SEM. For AR mRNA level, DMSO versus RGFP966 (1 μM): ***P = 9.42e‐05, DMSO versus RGFP966 (3 μM): ***P = 6.88e‐06; for NKX3.1 mRNA level, DMSO versus RGFP966 (1 μM): ***P = 1.47e‐04, DMSO versus RGFP966 (3 μM): ***P = 6.12e‐05; for PSA mRNA level, DMSO versus RGFP966 (1 μM): ***P = 8.24e‐04, DMSO versus RGFP966 (3 μM): ***P = 2.54e‐04; for TMPRSS2 mRNA level, DMSO versus RGFP966 (1 μM): ***P = 3.60e‐04, DMSO versus RGFP966 (3 μM): ***P = 6.81e‐05 were performed using the unpaired two‐tailed Student's t‐test.
-
BC4‐2 and 22Rv1 cells were treated with different concentrations of the HDAC3 inhibitor RGFP966 for 24 h and harvested for Western blot analysis with the indicated antibodies.
-
C, DC4‐2 cells transfected with V5‐CA‐AKT or HA‐AR were treated with two times of IC50 (2.5 μM) of RGFP966. The number of colonies after 10‐day treatment is shown in (C), and transfected proteins were analyzed by Western blots (D). The RT–qPCR was performed in triplicate for each sample. Data represent means ± SEM. For RGFP treatment, EV versus V5‐CA‐AKT, ***P = 0.0009; EV versus HA‐AR, **P = 0.0026. Statistical analysis was performed using the unpaired two‐tailed Student's t‐test.
Source data are available online for this figure.
