Figure 1.

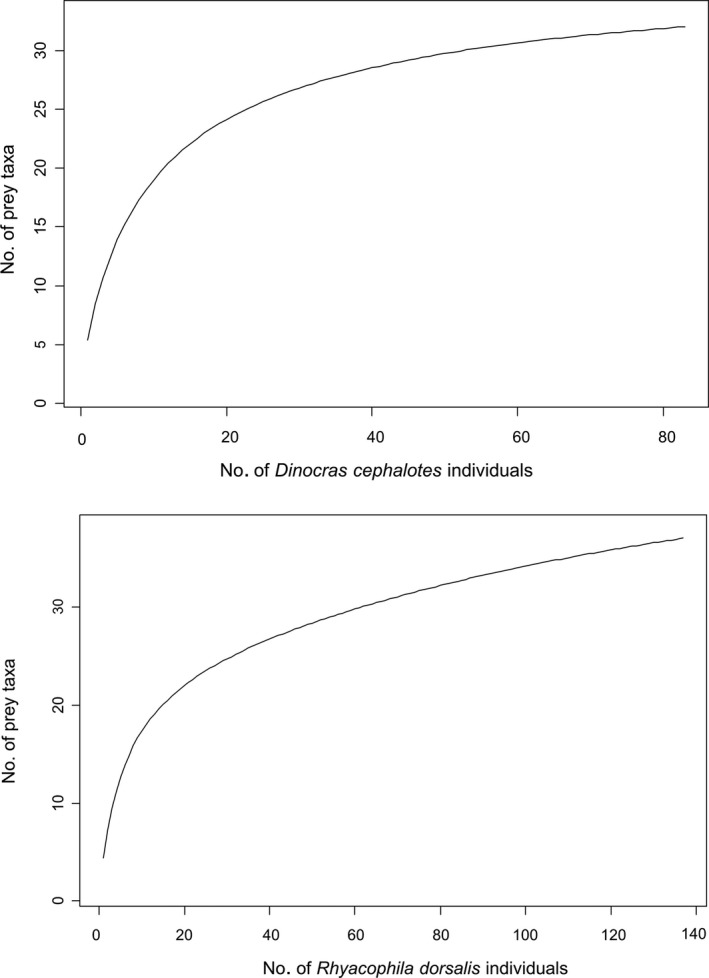
Smoothed yield‐effort accumulation curves for the number of prey taxa consumed by the two predators as a function of individual predators analysed

Smoothed yield‐effort accumulation curves for the number of prey taxa consumed by the two predators as a function of individual predators analysed