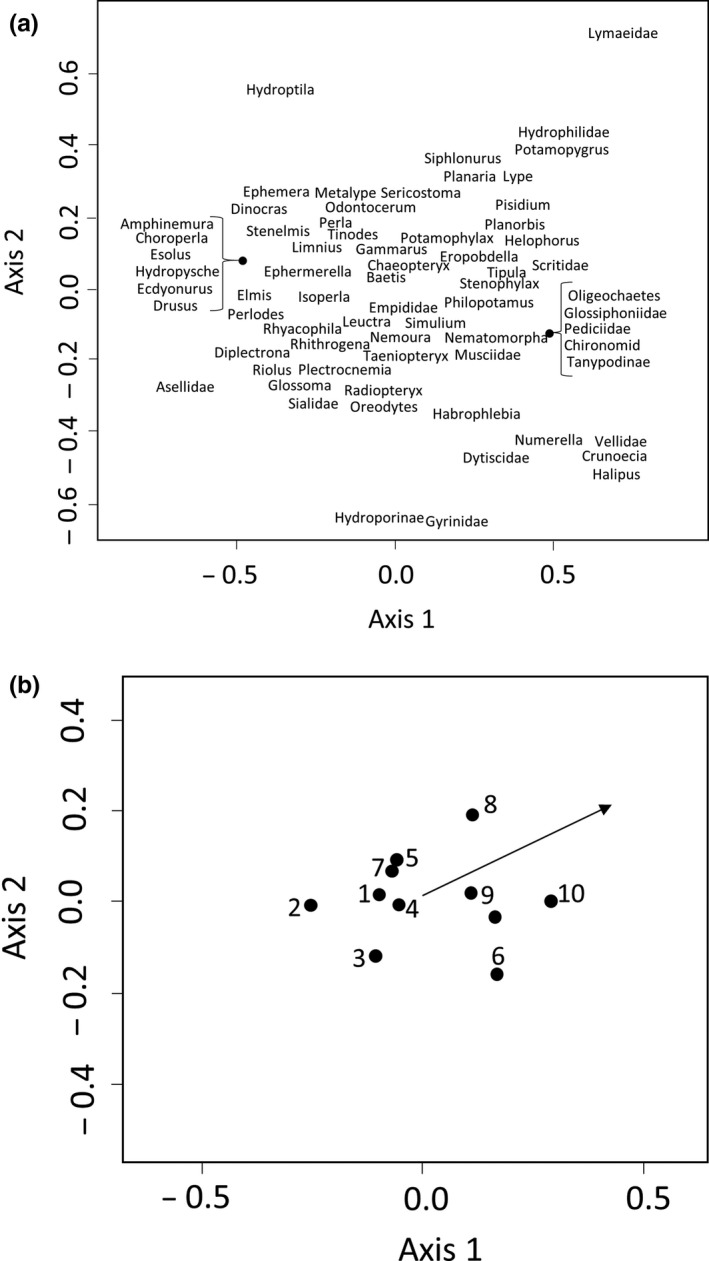
Figure 2.

Nonmetric multidimensional scaling analysis of prey community composition across the 10 streams spanning a gradient of agricultural intensity. Panel A shows the “species” scores, whilst panel B plots the individual sites, numbered based on rank of agricultural intensity (1 lowest, 10 highest). The arrow on the right‐hand plot shows the vector of increasing intensity score (r = .85 p = .002)
