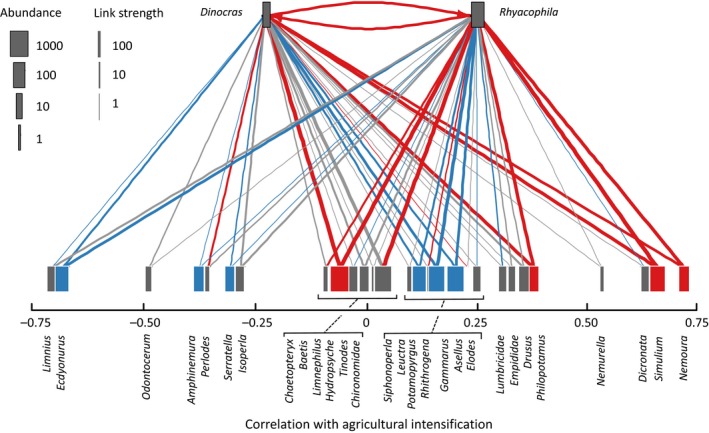
Figure 4.

The complete set of trophic links across the 10 streams, including intraguild predation, revealed by next‐generation sequencing. Prey taxa on the lower level are plotted using the Spearman's ρ correlation between their abundance and the land‐use intensity score, that is, positive values = taxa that increased in abundance with agricultural intensification. Link widths indicate the log10 frequencies with which taxa were consumed, coloured according to the comparison with the null model: red links = stronger than expected, blue links = weaker and grey = not significantly different. Node widths represent log10 mean abundance of each taxon: red nodes = preferred by both predators; blue nodes = avoided by both
