
Figure 5.
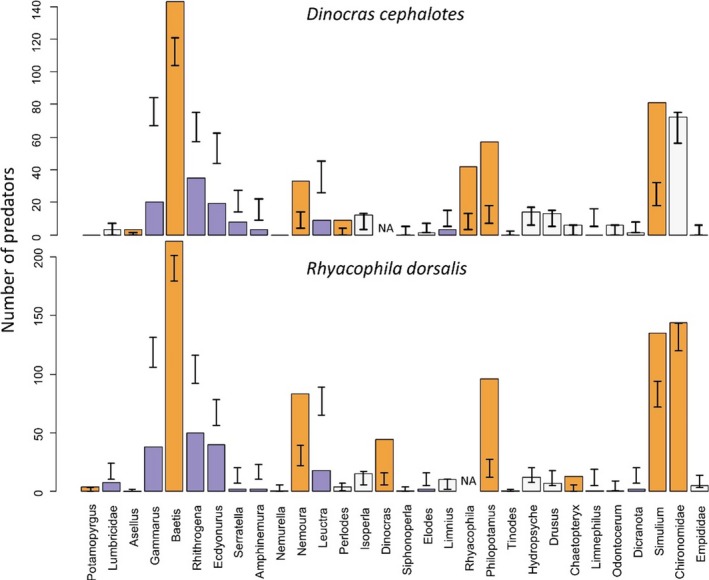
Number of predators consuming different prey taxa, compared to random expectation, based on prey availability. Error bars show 95% confidence limits of expected consumption: observed values falling outside of this range indicate significant deviation from random foraging (orange = preferred taxon, purple = avoided taxon)