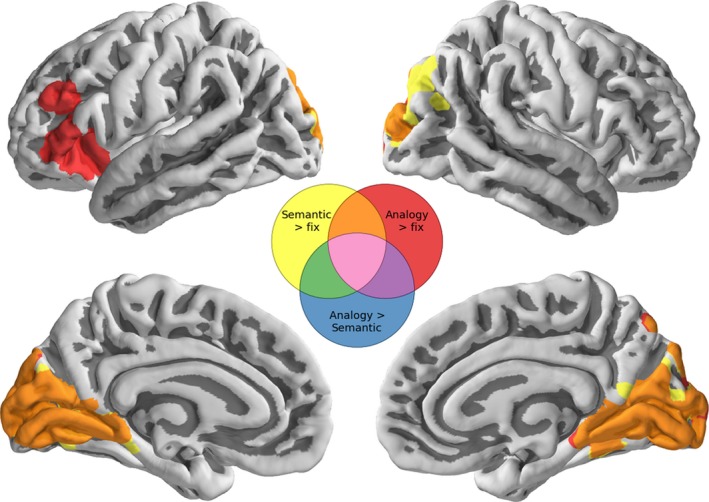
Figure 4.

Whole‐brain activation patterns showing regions that show an increase in activation with age across all participants. Results for the semantic greater than fixation contrast are shown in yellow, analogy greater than fixation in red, and regions for which both are increasing are shown in orange. There were no regions that showed a within‐person differential increase in activation during analogy trials compared to semantic trials. All results are constrained to be within regions liberally activated on average by the semantic or analogy tasks. Statistical tests are permutation tests, thresholds are set using a cluster defining threshold of Z > 2.3 and are family‐wise error‐corrected at p < .05. Thresholded and unthresholded maps are available in NeuroVault at http://neurovault.org/collections/1658
