
Figure 1.
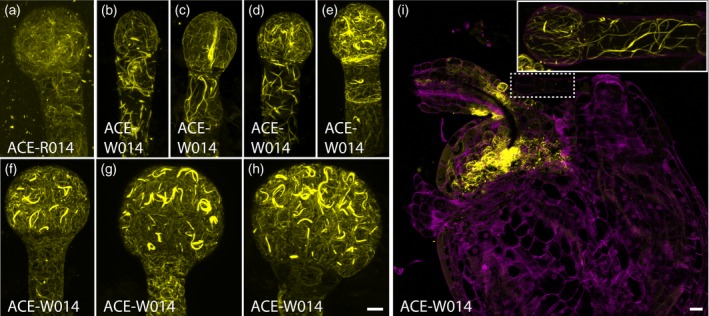
Expression of Arabidopsis cellular markers for embryogenesis (ACE) driven by pRPS5A (ACE‐R) and by pWOX2 (ACE‐W) during embryogenesis
(a) Maximum intensity projection of actin filaments labeled by ACE‐R14 (Lifeact:tdTomato) in the 16‐cell embryo. (b)–(h) Maximum intensity projections of actin filaments labeled by ACE‐W14 (Lifeact:tdTomato) in 1‐cell (b), 2‐cell (c), 4‐cell (d), 8‐cell (e), 16‐cell (f), early‐globular (g), and late‐globular (h) embryos. (i) Overview of ACE‐W14 (Lifeact:tdTomato) expression in the seed. Different acquisition settings were used to accommodate high expression in chalaza. Inset: maximum intensity projection of the 2‐cell embryo in the main panel marked by a dashed box with the acquisition setting used for embryos. Scale bar for (a)–(h) = 5 μm. [Colour figure can be viewed at http://wileyonlinelibrary.com]