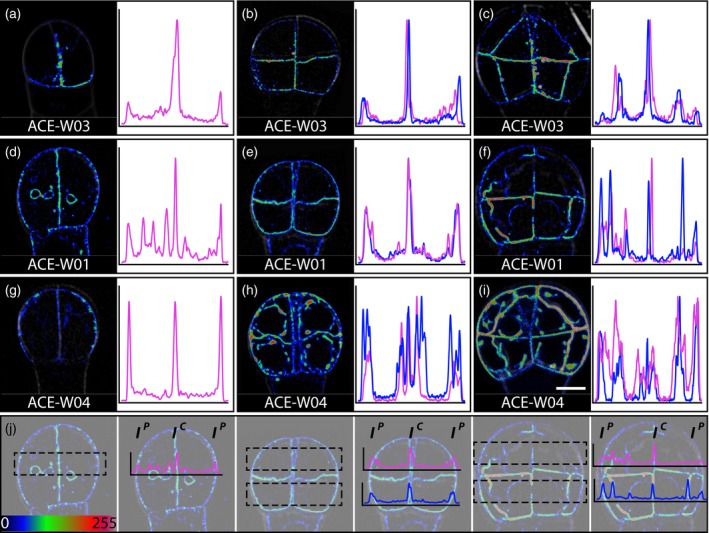
Figure 4.

Early establishment of inner–outer cell polarity in embryos.
Single optical sections through 2‐cell (a, d, g), 8‐cell (b, e, h) and 16‐cell (c, f, i) embryos expressing the inner membrane marker ACE‐W03 (a–c; BOR1:mCitrine), general plasma membrane marker ACE‐W01 (d–f; AtPIP2A:GFP) or outer membrane marker ACE‐W04 (g–i; mCherry:NIP5;1). Images are shown in an intensity color scale according to the look‐up table in the bottom left. In each panel, the fluorescence intensity profile is shown in a graph on the right side. Positions of each region for intensity profiles are indicated in panel (j) underneath each row of embryos. Fluorescence intensity profiles of upper (magenta) and lower (blue) tier cells were generated by averaging the fluorescence intensity of each pixel with the same x coordinate in the regions of interest (ROI) shown as dashed boxes. The fluorescence intensity ratios are ratios between I C and I P. Images from the same markers were acquired with the same acquisition setting and are in same scale. Scale bar = 5 μm. [Colour figure can be viewed at http://wileyonlinelibrary.com]
