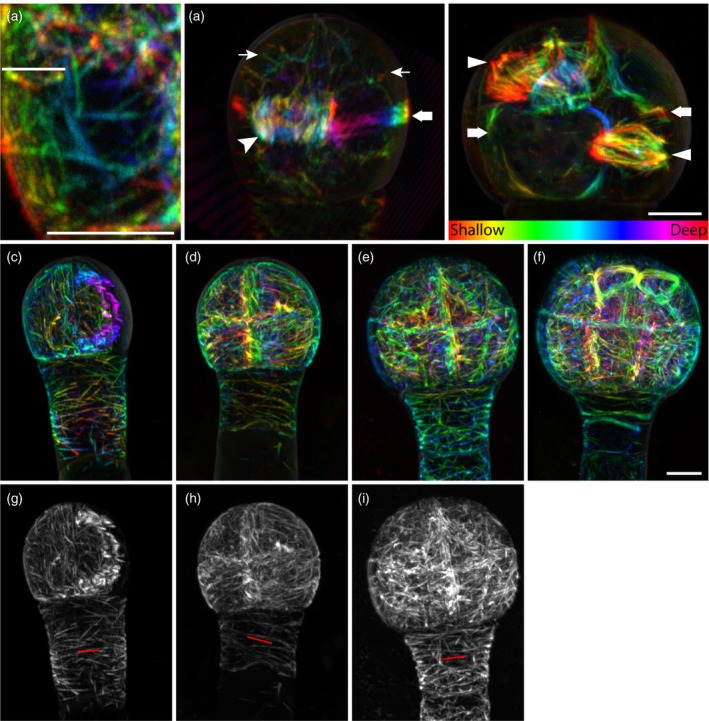
Figure 7.

Microtubule topologies in early embryos.
Labeling of microtubules with the ACE‐W15 (mGFP:AtTUA6) marker reveals filaments (a), as well as cytoplasmic signals (thin arrows in the left image of panel b), phragmoplast (arrowhead in the left image of panel b), preprophase band (thick arrows in both left and right images in panel b) and spindles (triangles in the right image in panel b) in early embryos. (c)–(i) Microtubules in 4‐cell (c, g), 8‐cell (d, h), 16‐cell (e, i) and early globular (f) embryos shown either as depth‐coded stacks (c–f) or maximum intensity projections (g–i). The orientation of cortical microtubules in the suspensor is marked by red lines in (g)–(i). Images were acquired with same acquisition settings and are in the same scale, except for (a) and (b). Scale bar = 5 μm. [Colour figure can be viewed at http://wileyonlinelibrary.com]
