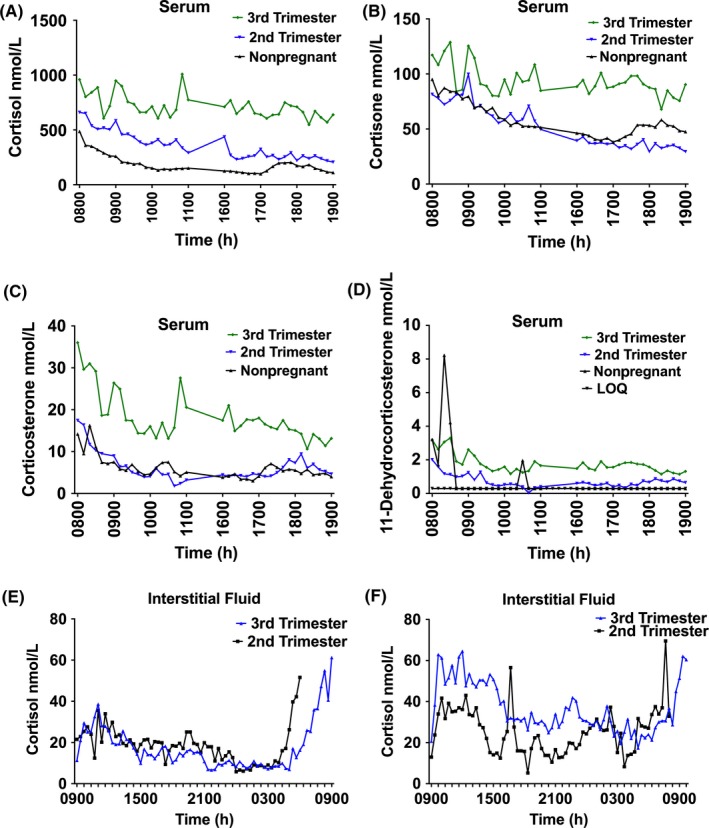
Figure 1.

A‐F, Serum and interstitial fluid. Profiles of serum cortisol (A), cortisone (B), corticosterone (C) and 11‐dehydrocorticosterone (D). Each figure demonstrates the individual hormone profiles of one representative subject who was studied 2 months prepregnancy, at visit 1 (17 + 2 weeks’ gestation) and visit 2 (third trimester (30 + 6 weeks’ gestation). Interstitial fluid cortisol profiles from 2 representative lean subjects obtained at 17 + 2 and 31 weeks (E) and 18 + 3 and 32 + 3 weeks (F). Key: LOQ (limit of quantification) [Colour figure can be viewed at http://wileyonlinelibrary.com]
