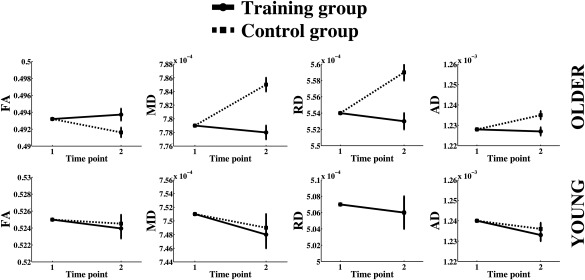
Figure 3.

Group differences in microstructural changes are plotted separately for young and older adults. The means of the skeletonized diffusion metrics are shown on the Y‐axis. The axis ranges are of equal size for young and older adults, but the values vary due to age differences in diffusion metrics.
