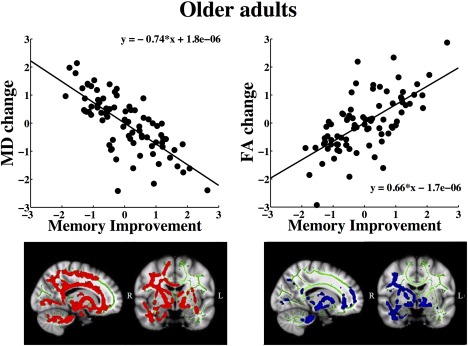
Figure 5.

Areas showing relationships between memory improvement and microstructural changes in the older sample. Sagittal and coronal views of Talairach coordinates x = 74, y = 120, z = 85, overlaid on the mean FA skeleton (green) and the standard MNI152 T1 1 mm3 brain template. The results are thresholded at P < 0.05 and corrected for multiple comparisons. Significant areas are dilated for illustrative purposes. The plots show the relationships between MD and FA change and memory improvement measured by standardized residuals.
