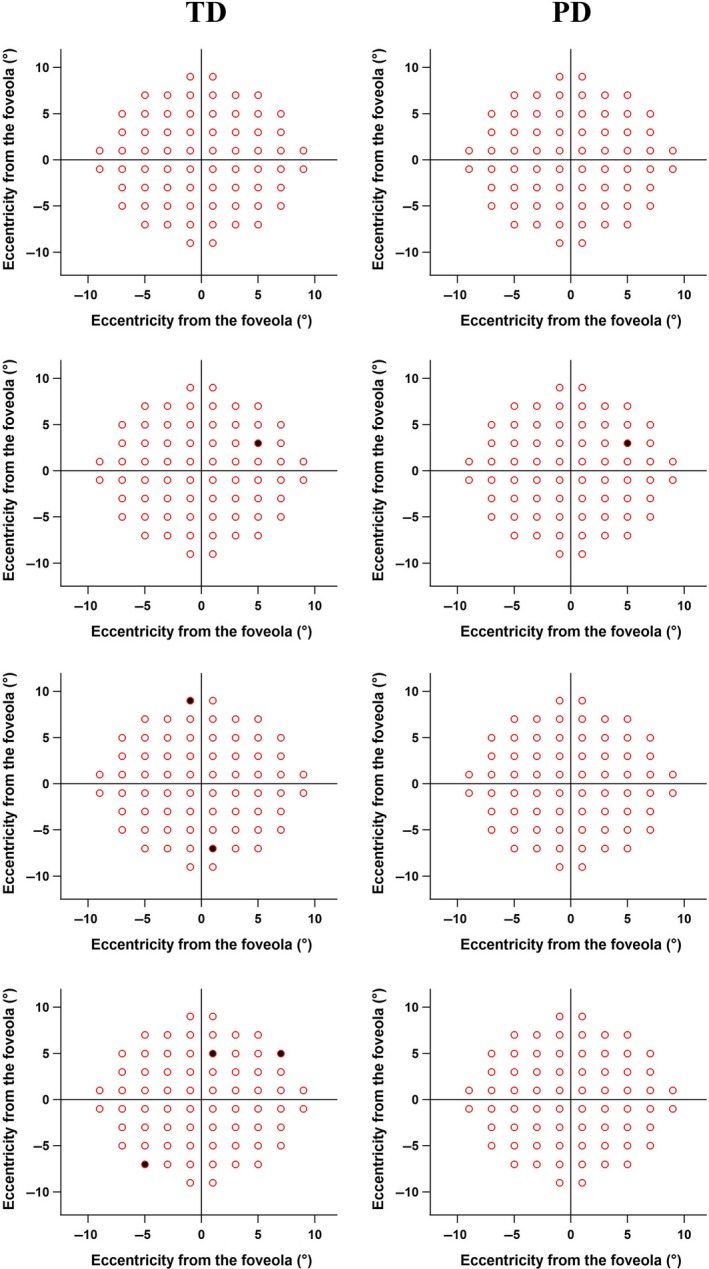
Figure 3.

Total Deviation (TD) and Pattern Deviation (PD) maps from 30 control participants. The top row represents plots for 27 participants where no abnormal perimetric locations were found. The second row shows a control participant whose data showed one abnormal perimetric location in both TD and PD maps. The third and fourth rows demonstrated abnormal perimetric locations in TD maps but not in the PD maps.
