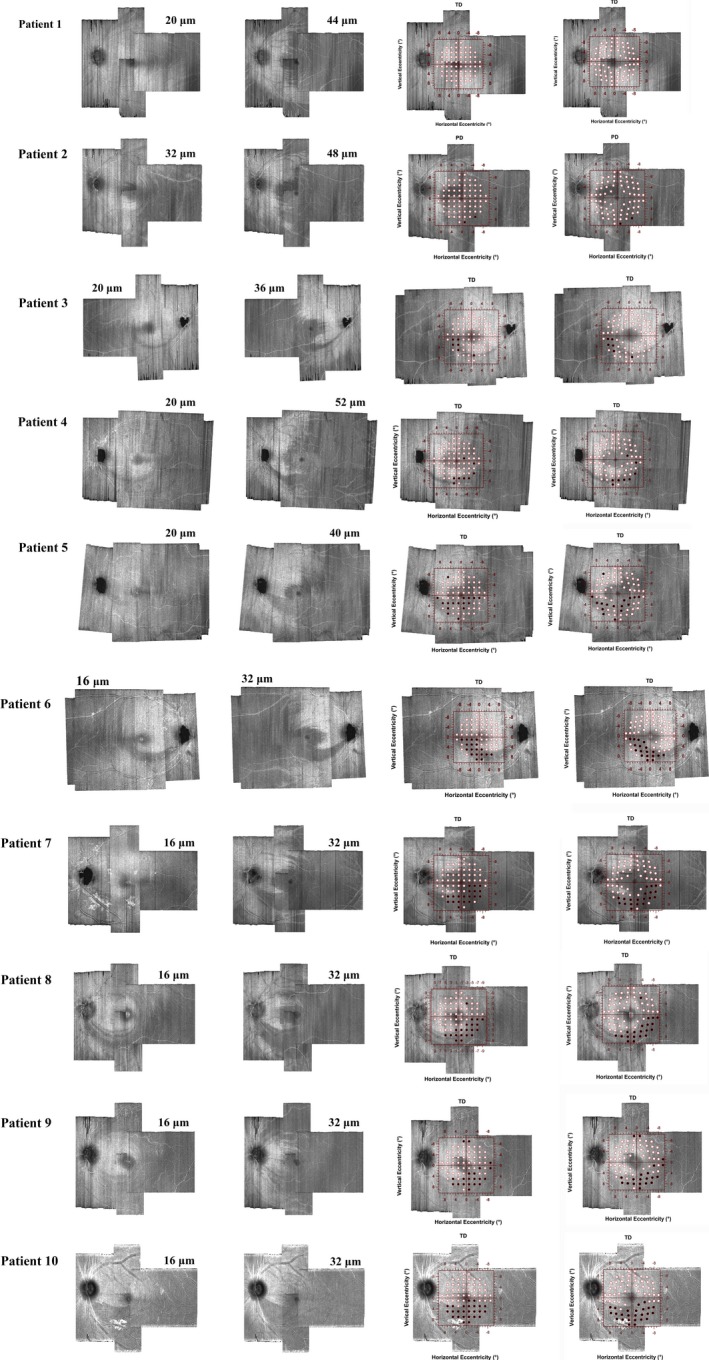
Figure 4.

Results from individual patients with glaucoma. The two left columns demonstrate depths used with en face images to better characterise the glaucomatous damage. The first column indicates superficial depths (ranging from 16 to 20 microns from the ILM) while the second column indicates deeper depths (ranging from 32 to 52 microns). The third and fourth columns show the TD values of the 10‐2 grid superimposed on the en face images with (fourth column) and without (third column) accounting for the displacement of ganglion cell bodies, black circles indicate abnormal perimetric locations. TD values were similar to PD, except for a patient in the second row in which PD was shown because the TD map did not show abnormal locations. The y‐axis of the visual field map was flipped in order to correspond to retinal coordinates.
