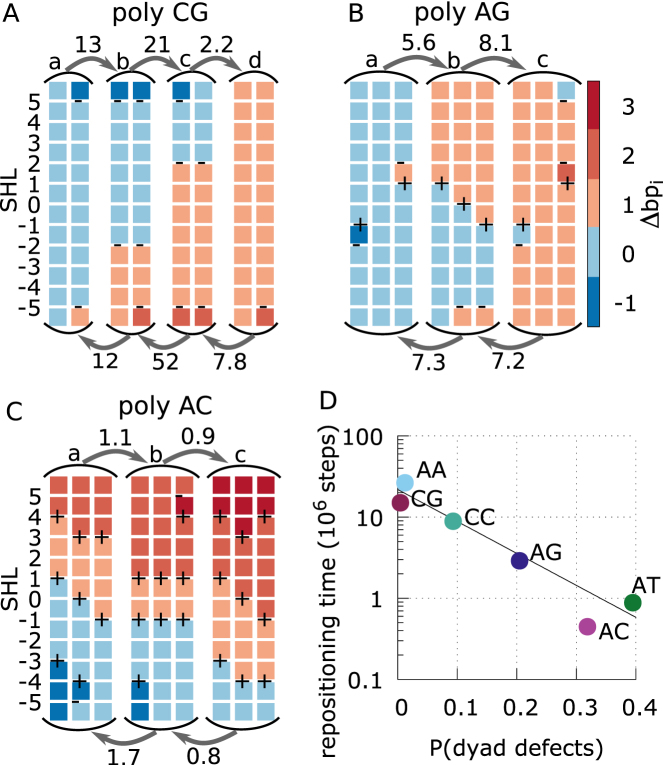
Figure 6.
Sliding pathways and kinetics derived from Markov state models. (A–C) MSMs for poly-CG, AG, and AC (which is similar to the omitted AT case) in panels A, B and C, respectively, showing the mean first passage times (MFPTs) of the transitions between the long-lived basins of the system along a 1 bp repositioning pathway, and a sample of the most populated nucleosome conformations within each basin. The labels (a, b, c and d) on the states correspond to those indicated in the free energy landscapes of Figure 5. Each column represents a nucleosome conformation, with each colored square representing a section of 10 bps of DNA bound to a nucleosome contact point. The color of the square correspond to the contact index of that DNA section, with the DNA undergoing a screw-like rotation in the negative SHL direction as the color changes from blue towards red. The presence of under-twisting or over-twisting at each SHL is respectively indicated by the symbols – and +. MFPTs are given near the arrows in units of 106 MD steps. Most basins have similar equilibrium probabilities, except for the poly-CG case, where the basins with a defect at SHL ±2 have a free energy of about 2kBT relative the basins without defects there. (D) Repositioning times for each DNA sequence as a function of the average probability to find excited defect configurations at the three central SHLs (–1,0,1). Here we consider any deviation from the lowest energy state, which in most cases correspond to the configuration found in the 1KX5 reference. However, in the case of poly-CC, over-twist defects are the ground state at SHL ±1, and we consider instead the probability to find a non-defect (excited) state, which is expected to be relevant for repositioning.

