Figure 9.
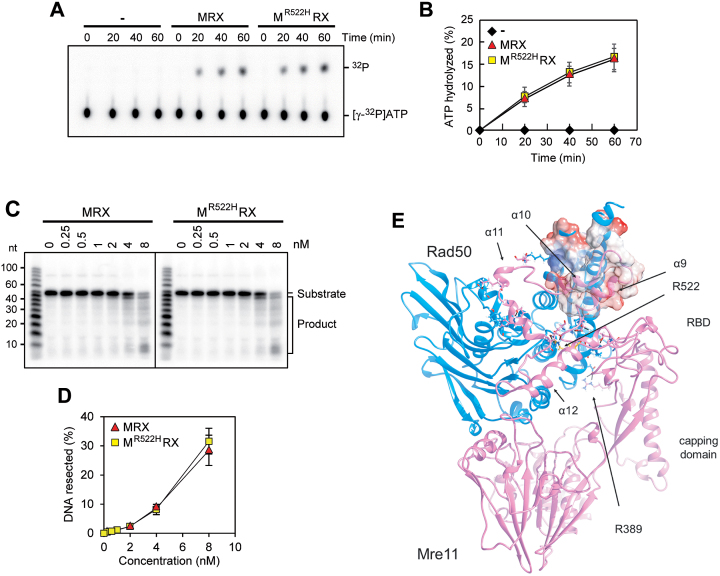
Functional and structural characterization of Mre11-R522H. (A, B) ATP hydrolysis by wild type MRX or MR522HRX mutant (100 nM of each) in the presence of 100-bp dsDNA (200 nM) (A). The results from three independent experiments were quantified (B). The mean values are represented with error bars denoting S.D. (n = 3). (C, D) The nuclease activity of wild type MRX or MR522HRX complex was tested on the 5′-labeled 95 bp dsDNA (8 nM) with 5 nt 3′ overhangs and a nick 55 nt away from the labeled end. The results were quantified, based on the product at the gel bottom, with error bars denoting S.D. (n = 3). (E) A model for Mre11 comprising Rad50 binding domain (RBD) was optimized by molecular dynamics. The position of residue R522 (in yellow) and of residues involved in Mre11–Rad50 interaction are shown. The Coulomb potential surface (red, negative charge; white, hydrophobic surface; blue, positive charge) is represented for the coiled-coiled region of Rad50 and Mre11 α9 and α10, which mainly share hydrophobic interactions.

