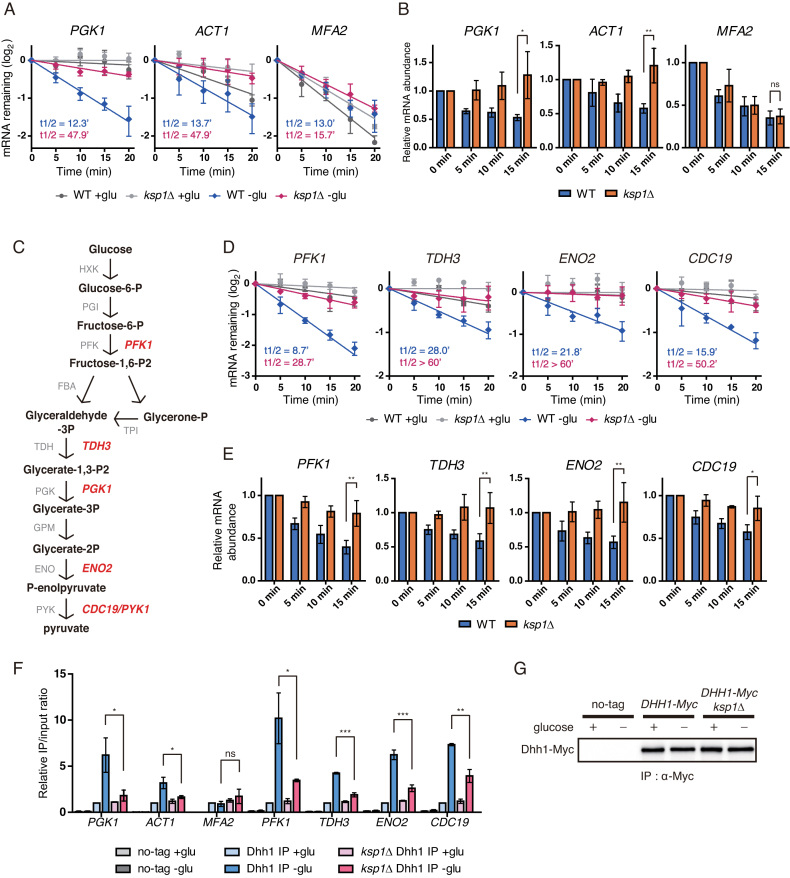
Figure 4.
Specific mRNAs are targeted by KSP1-dependent mRNA decay. (A) Decay curves of PGK1, ACT1 and MFA2 after thiolutin treatment in WT and ksp1Δ cells under glucose deprivation conditions. X-axis, time after thiolutin treatment. (B) Time-course measurement of mRNA levels of PGK1, ACT1 and MFA2 in WT and ksp1Δ cells after glucose deprivation. X-axis, time after glucose deprivation. (C) The glycolysis pathway and its enzymes in yeast. Glycolytic genes tested in this study are represented in red. (D) Decay curves of glycolytic mRNAs after thiolutin treatment in WT and ksp1Δ cells. X-axis, time after thiolutin treatment. (E) Time-course measurement of glycolytic mRNA levels in WT and ksp1Δ cells after glucose deprivation. X-axis, time after glucose deprivation. (F) RNA immunoprecipitation using an anti-c-Myc antibody to immunoprecipitate Dhh1-Myc and its associated transcripts. Dhh1-Myc was immunoprecipitated from each strain, and its associated mRNAs were analyzed by qRT-PCR. (G) Western blotting of immunoprecipitated Dhh1 from each strain. For (A) and (D), data were fitted to one-phase exponential decay curve to determine mRNA half-lives. For (B) and (E), cDNA was synthesized using random primers, and mRNA levels were normalized to SCR1. Relative mRNA levels were calculated using the 2−ΔΔCt method. Error bars indicate SD of experiments performed in triplicate. P-values were determined by Student’s t-test (***P < 0.005; **P < 0.01; *P < 0.05; ns, P > 0.05).

