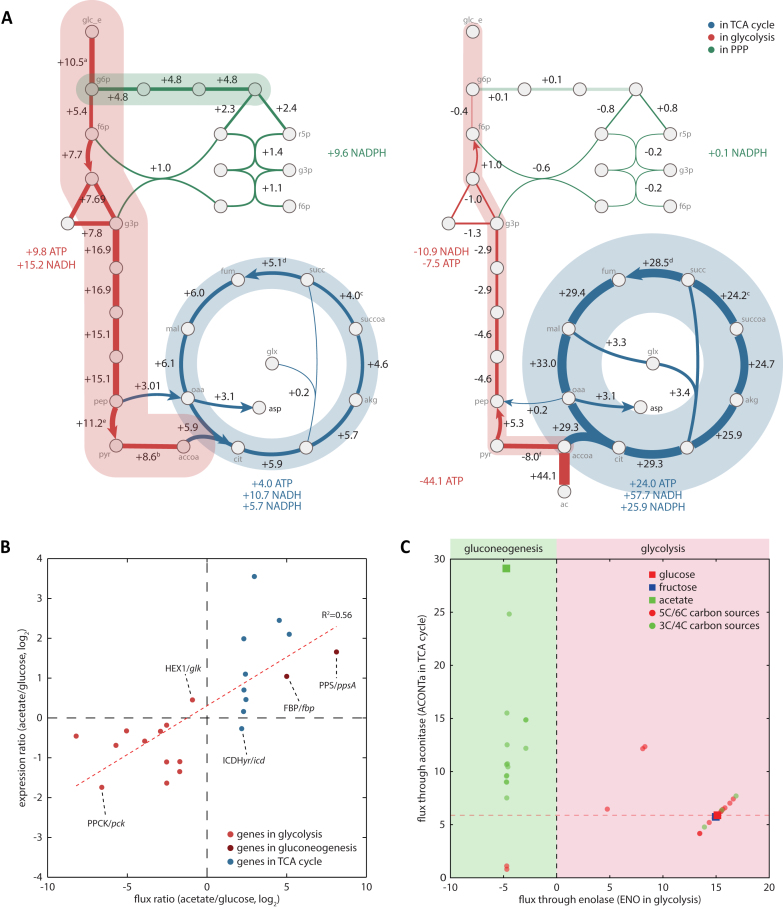
Figure 3.
Simulated flux through the carbon metabolism explains decoupling of glycolysis and the TCA cycle and more flux through TCA cycle on poor carbon sources. (A) Normalized fluxes through glycolysis, TCA cycle, and PP pathway were calculated on glucose and acetate with a net energy production or consumption from each pathway. Consistent with the expression profiling, the TCA cycle had more activated flux on acetate than on glucose. a: HEX1+GLCptspp, b: PDH-PFL, c: -PPCSCT-SUCOAS, d: SUCDi-FRD2-FRD3, e: PYK+GLCptspp, f: PDH-PFL+POR5, g: ACS-PTAr. (B) Comparison between the simulated flux ratio (acetate/glucose) through the reactions in glycolysis and the TCA cycle and the expression change of genes that are responsible for those reactions. The flux ratio and expression ratio have a good correlation (R2 value = 0.56). Only two reactions, HEX1 and ICDHyr, disagreed. Reactions in the TCA cycle are more activated in terms of flux and transcription, and reactions in glycolysis are repressed, illustrating a decoupling between reactions in glycolysis and the TCA cycle. (C) Normalized fluxes were calculated for 38 carbon sources: 1 for 2-carbon carbon source, acetate, 9 for 3-carbon carbon sources, 8 for 4-carbon carbon sources, 6 for 5-carbon carbon sources, and 12 for 6-carbon carbon sources. Enolase (ENO) and aconitase (ACONTa) were chosen as representative reactions for glycolysis (x-axis) and the TCA cycle (y-axis). 5- and 6-carbon carbon sources tend to render higher flux through glycolysis than the TCA cycle, whereas 2-, 3- and 4-carbon carbon sources showed more flux through the TCA cycle, with much less flux through glycolysis.

