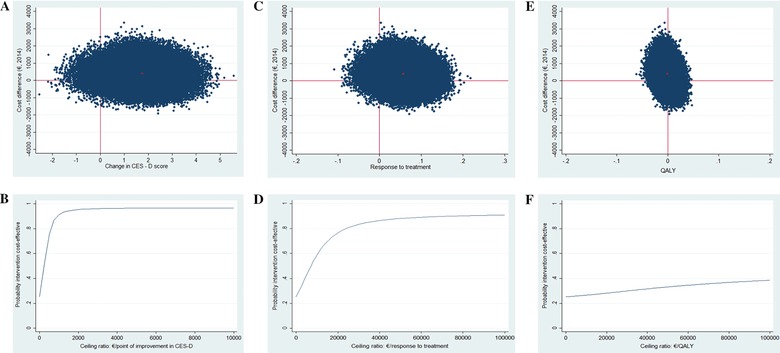
Figure 2.

Cost‐effectiveness plane at 12 months of Internet‐based treatment versus control condition for (a) improvement in CES‐D score, (c) response to treatment, and (e) QALYs. Cost‐effectiveness acceptability curve for (b) improvement in CES‐D score, (d) response to treatment, and (f) QALYs at 12 months
