
Figure 2.
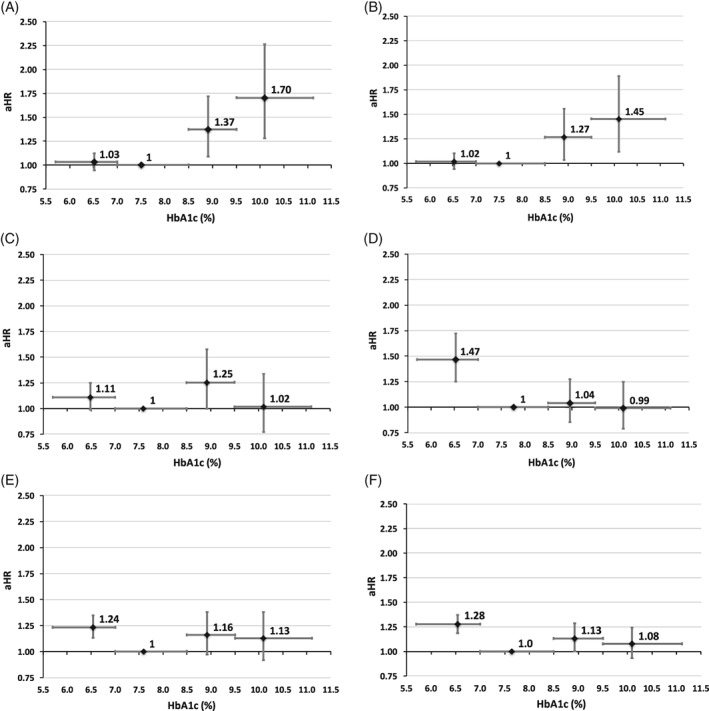
Relative risk of death by glycated haemoglobin (HbA1c) category when HbA1c is modelled as a mean, quarterly updated, time‐dependent covariate. Data from alternative models are detailed in Figure S2. A, Metformin monotherapy. B, Regimens with a low hypoglycaemia risk. C, Sulphonylurea monotherapy. D, Insulin monotherapy. E, Regimens with a higher hypoglycaemia risk excluding insulin. F, Regimens with a higher hypoglycaemia risk including insulin. Vertical error bars represent the 95% confidence interval (CI) for adjusted hazard ratio (aHR) and the horizontal error bars represent the HbA1c range