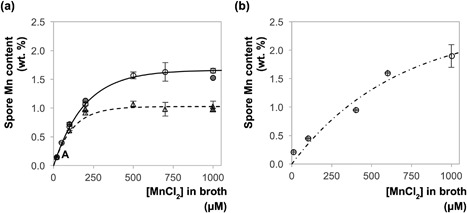
Figure 3.

Plot showing the accumulation of manganese with increasing concentration of MnCl2 in the culture medium of (a) B. megaterium spores; (b) B. cereus spores. Key: circles, untreated spores; triangles, acid treated spores; open symbols, data obtained by SQUID measurements; solid symbols, ICP‐OES measurement for the closest corresponding solid symbol sample. The position denoted ‘A’ contains three data points that overlap. Lines show the fit of data sets to Equation (9): solid locus, untreated B. megaterium spores, a 1 = 1.66 wt.% and a 2 = 196 µM; dashed locus, acid‐treated B. megaterium spores, a 1 = 1.03 wt. % and a 2 = 119 µM; dot‐dashed locus, untreated B. cereus spores, a 1 = 2.46 wt.% and a 2 = 661 µM. Tables containing presented data are provided in the supplementary information (Supplementary Tables S1–S3). The error bars indicate the uncertainty derived from SQUID measurements
