
Figure 4.
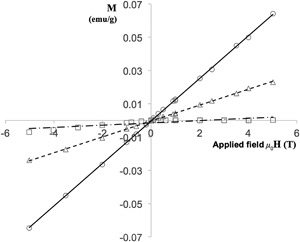
Magnetisation at 300 K of three B. megaterium spore samples cultured in different concentrations of MnCl2. Key: squares, 20 µM MnCl2; triangles, 50 µM MnCl2; circles, 100 µM MnCl2. Lines represent the line of best fit to Equation (2); the gradients are 20 µM, 0.68 × 10⁻⁶; 50 µM, 4.77 × 10⁻⁶; 100 µM, 1.28 × 10⁻⁶. Error bars indistinguishable when plotted