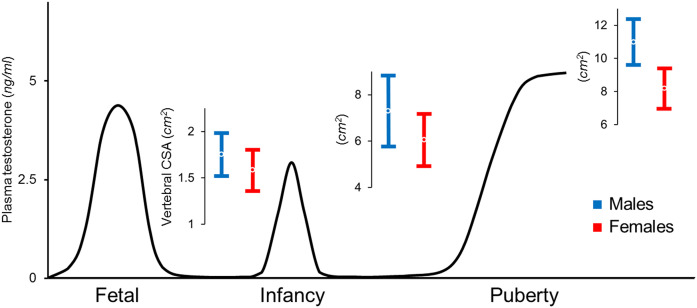
Figure 2.
Representation of plasma testosterone levels in the male fetus, infant, and adolescent (83), with overlying values for vertebral CSA (mean ± standard deviation) displaying increasing sex differences from birth to prepubertal and postpubertal stages. Female values are ~10% smaller at birth, 15% smaller during childhood, and 25% smaller at sexual maturity and young adulthood (27, 93, 134).

