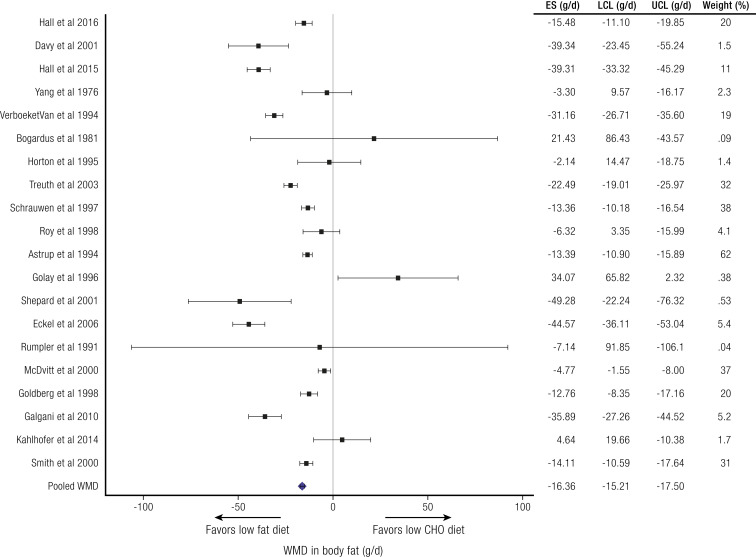
Figure 4.
Weight loss comparing isocaloric low-carbohydrate/high-fat and high-carbohydrate/low-fat diets where meals were provided and protein consumption was the same. 95% horizontal CI. CHO, carbohydrate; ES, effect size; LCL, lower confidence limit; UCL, upper confidence limit; WMD, weighted mean difference. See Hall and Guo, 2017 (235).

