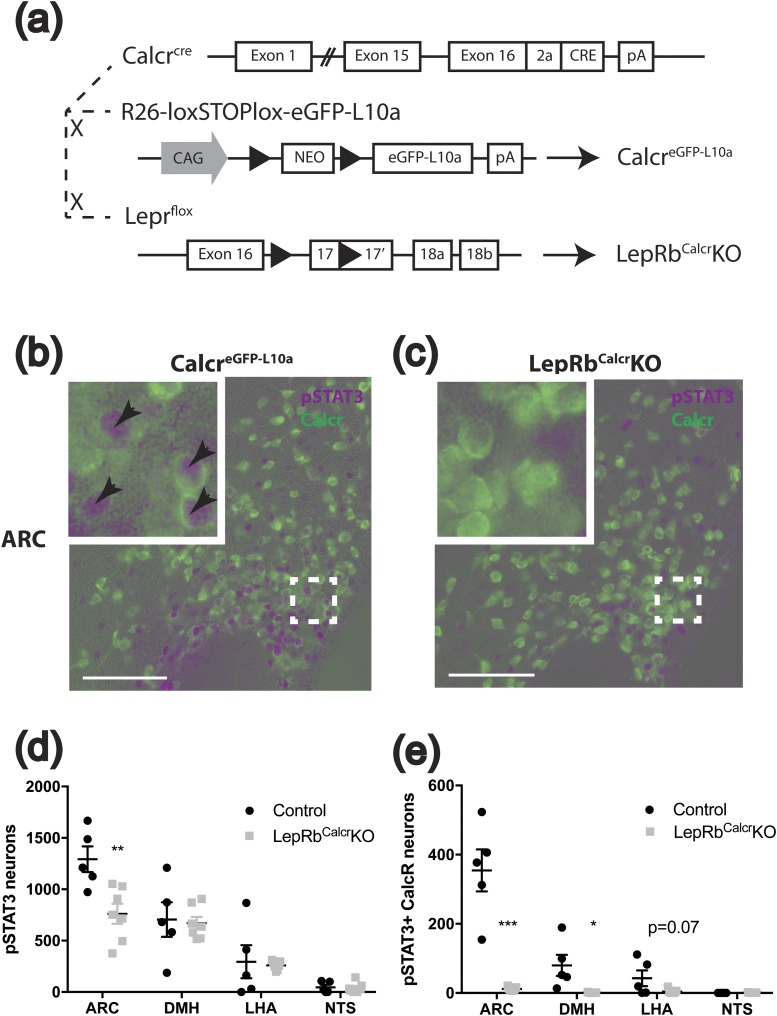
Figure 2.
Generation of Calcrcre, CalcreGFP-L10a, and LepRbCalcrKO mice. (a) Schematic diagram showing the cross of Calcrcre mice with Rosa26-loxSTOPlox-eGFP-L10a (Rosa26eGFP-L10a) mice to generate CalcreGFP mice and the cross of Calcrcre with Leprflox/flox mice to generate LepRbCalcrKO mice. (b, c) Representative images showing colocalization of pSTAT3-IR (purple) with GFP-IR (green) in the ARC of 4-week-old CalcreGFP-L10a and LepRbCalcrKO mice (both on the Rosa26eGFP-L10a background) treated with leptin (5 mg/kg, i.p.) for 90 minutes. Insets show a digital zoom of the boxed region. Arrowheads indicate colocalized neurons. Scale bars = 100 μm. (d, e) pSTAT3 and GFP IR neurons and double-labeled neurons were quantified for the indicated regions and the number of cells positive for pSTAT3, and doubled-labeled pSTAT3+GFP cells are plotted by region. Graphs show mean value ± the standard error of the mean. *P < 0.05; **P < 0.01; ***P < 0.001. CAG, chicken β-actin promoter; DMH, dorsomedial hypothalamic nucleus; LHA, lateral hypothalamic area; NEO, neomycin resistance cassette; NTS, nucleus of the solitary tract; pA: polyadenylation signal.

