Figure 4.
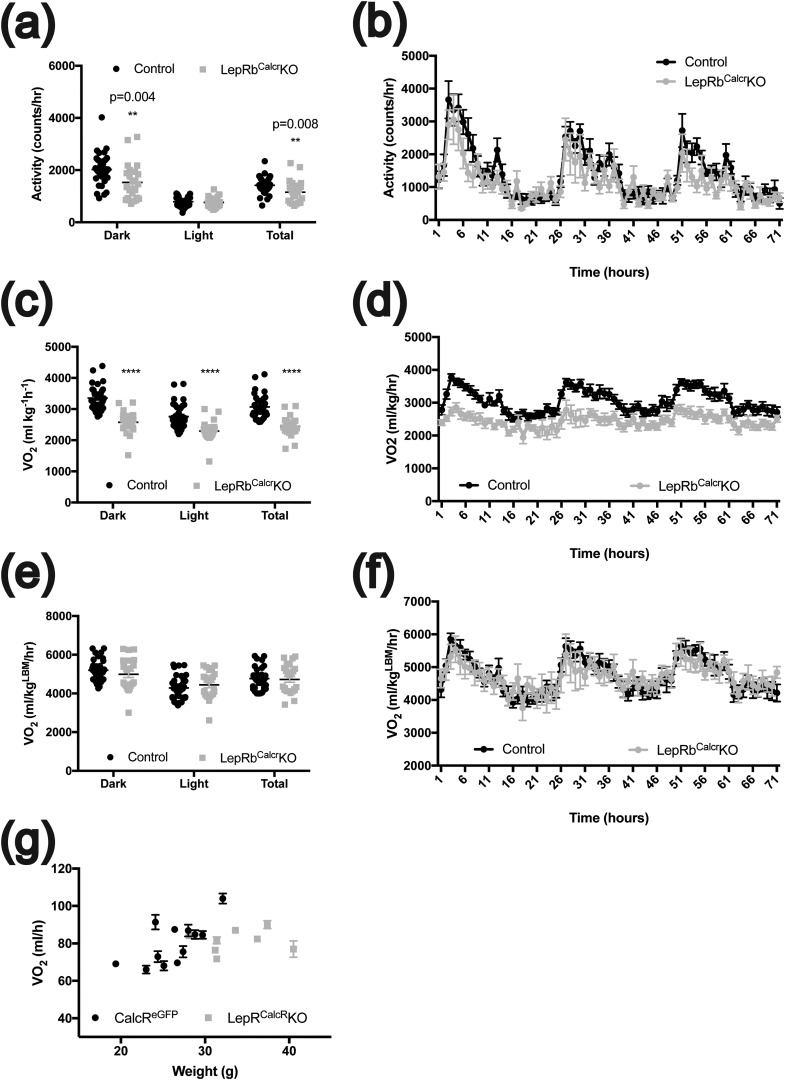
Control of activity and energy expenditure by leptin action on LepRbCalcr neurons. The 9- to 11-week-old male CalcreGFP-L10a mice (Controls; n = 12) and LepRbCalcrKO mice (n = 8) were subjected to Comprehensive Laboratory Animal Monitoring System (Columbus Instruments) analysis to determine (a, b) locomotor activity; (c, d) Vo2 normalized to total body mass; and (e, f) Vo2 adjusted to lean body mass. Data are shown for (a, c, e) dark cycle (Dark), light cycle (Light), and 24 hours (Total) and (b, d, f) the entire hour-by-hour 72-hour period. (g) Graph shows 24-hour Vo2 consumption rate plotted against body weight for each animal. (b, d, f, g) Mean ± standard error of the mean is shown. **P < 0.01; ****P < 0.0001.

