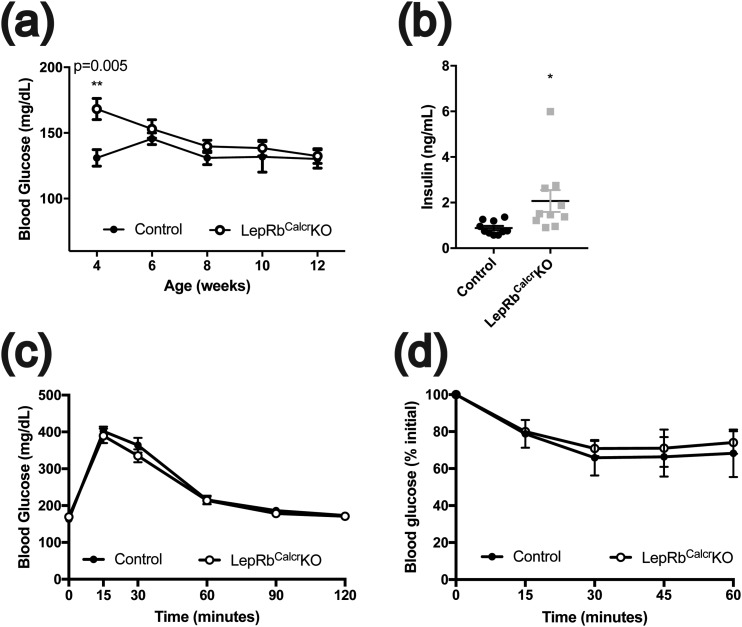
Figure 5.
Relatively preserved glycemic control in LepRbCalcrKO mice. Shown are (a) blood glucose concentrations from 4 to 12 weeks of age, (b) serum insulin concentrations at 10 weeks of age, (c) glycemic excursions during glucose tolerance test (2 g/kg glucose, i.p.) at 12 weeks of age, and (d) insulin tolerance test (1 U/kg insulin, i.p.) at 13 weeks of age for male CalcreGFP-L10a (Control) and LepRbCalcrKO mice. Mean ± standard error of the mean is shown. *P < 0.05; **P < 0.01 by t test.

