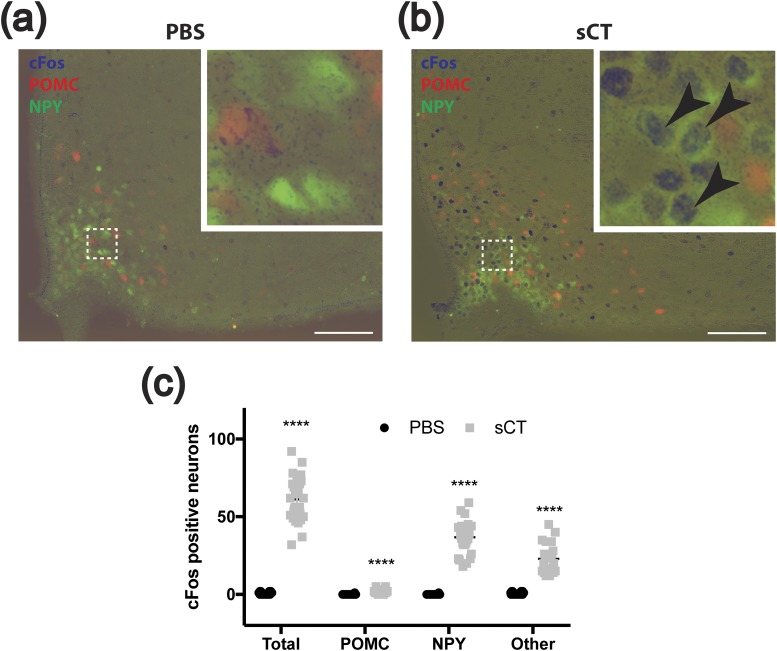
Figure 6.
sCT-induced cFos in ARC NPY neurons. (a, b) Shown are representative images of cFos-IR (blue), dsRed-IR (red), and GFP-IR (green) in the ARC of POMCdsRedNPYGFP mice after treatment with (a) vehicle (PBS) or (b) sCT (150 μg/kg, i.p.). Insets show a digital zoom of the boxed area. Arrowheads indicate colocalized neurons. Scale bars = 100 μm. (c) Graph shows counts of ARC cFos-IR (Total), those dual-labeled with dsRed-IR (POMC), those dual-labeled with GFP-IR (NPY), and those not colocalized with either (Other). Shown are mean value ± the standard error of the means. ****P < 0.0001 by t test. PBS, phosphate-buffered saline.

