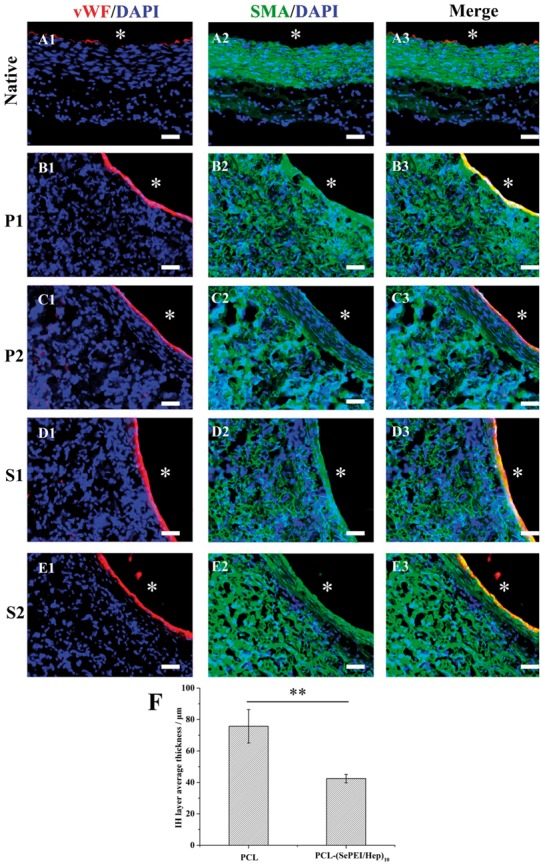
Figure 6.

Endothelialization and smooth muscle regeneration in the grafts after 1 month and 2 months after implantation. ECs were immunostained by vWF (red), SMCs were immunostained by α-SMA (green), and cell nuclei were counterstained by DAPI (blue). A1–A3: native vascular, P1 (B1–B3): PCL after 1 month, P2 (C1–C3): PCL after 2 months, S1 (D1–D3): PCL-(SePEI/Hep)10 after 1 month, S2 (E1–E3): PCL-(SePEI/Hep)10 after 2 months. Graft lumen was indicated by *. The dotted lines indicated IH. Scale = 50 μm. (F) IH progresses after 2 months in terms of thickness is measured (**P < 0.01)
