Figure 3.
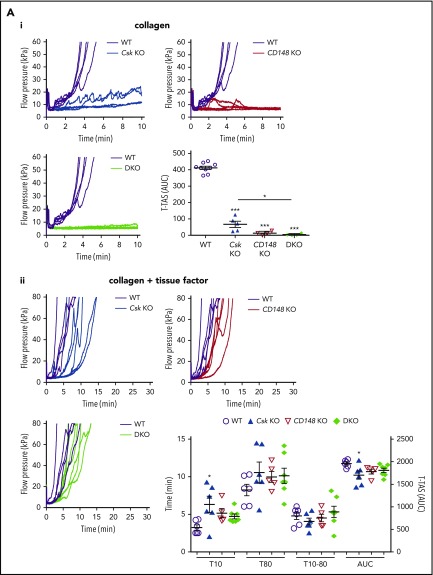
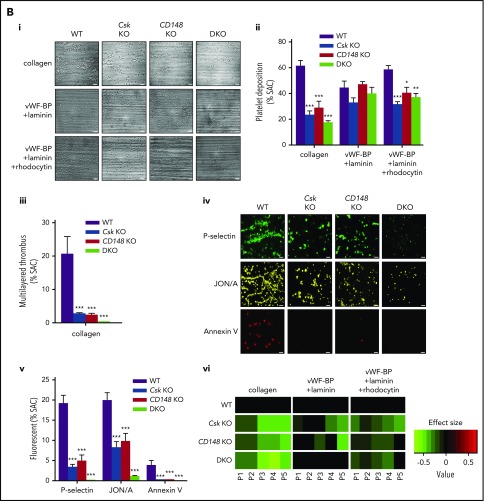
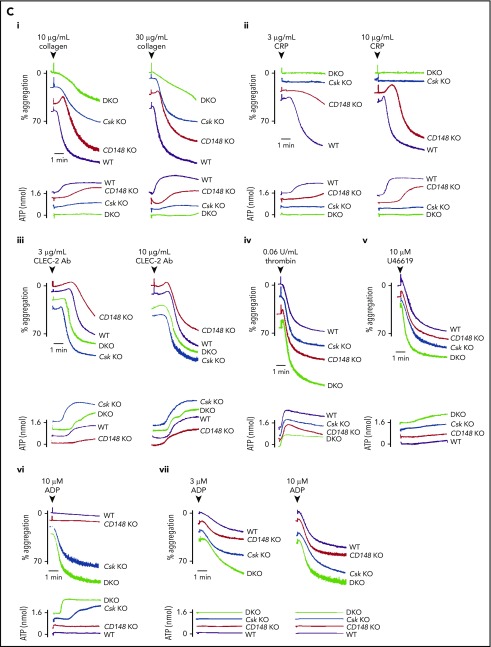
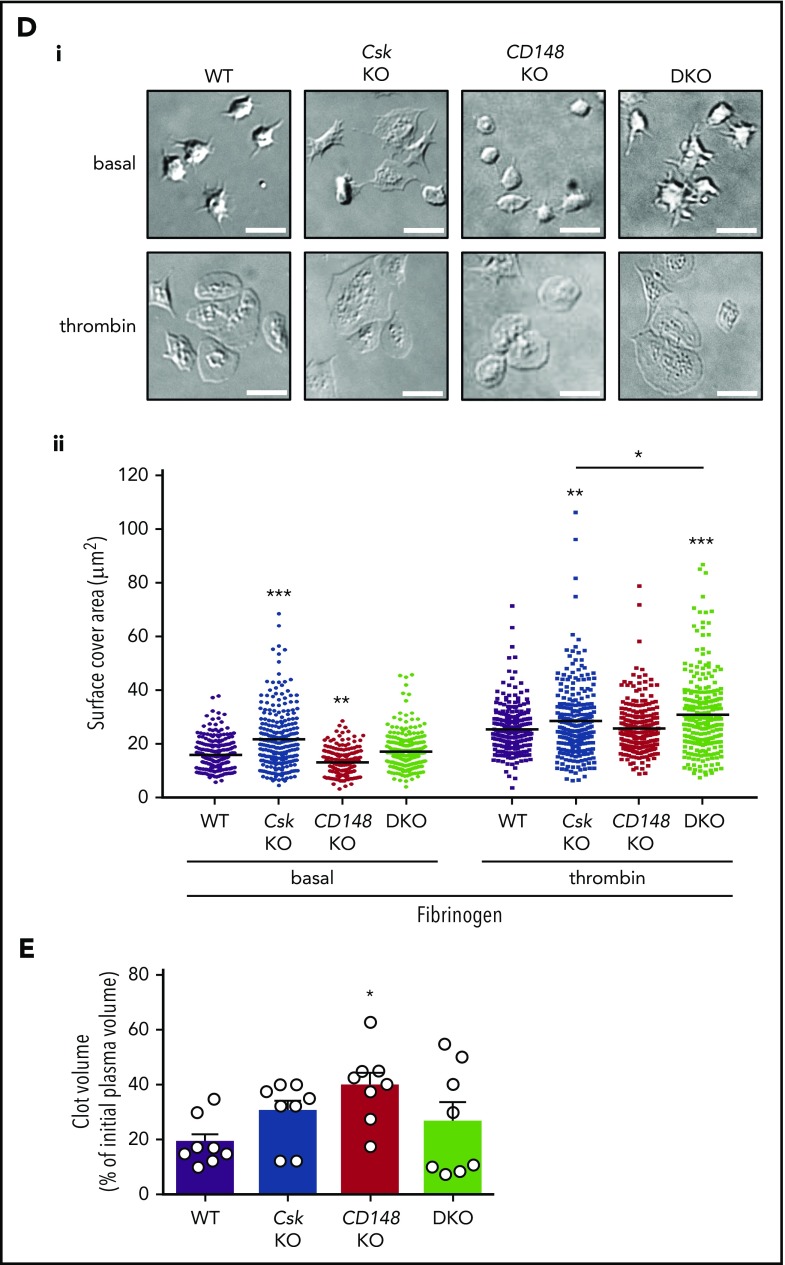
Aberrant platelet functions in Csk KO, CD148 KO, and DKO mice. (Ai) 25 μg/mL hirudin-treated blood was perfused with collagen-coated chip at 1000 s−1 for 10 minutes. Individual time-dependent flow pressure curves and total thrombogenicity (area under the curve [AUC]) were measured by the total thrombus-formation analysis system (T-TAS). (Aii) Blood treated with 3.2% sodium citrate, 12 mM CaCl2, and 50 μg/mL corn trypsin inhibitor was perfused on collagen plus tissue thromboplastin (tissue factor)–coated chip at 240 s−1 for 30 minutes. Individual time-dependent flow pressure curves, time to onset (T10), time to occlusion (T80), rate of thrombus growth (T10-80), and AUC were measured by T-TAS (n = 4-9 per genotype). (B) Blood treated with 5 U/mL heparin, 40 μM PPACK, and 50 U/mL Fragmin was perfused over microspots with indicated coatings; 100 μg/mL collagen I, 12.5 μg/mL vWF-BP, 50 μg/mL laminin, and 250 μg/mL rhodocytin for 3.5 minutes at 1000 s−1. (Bi) Representative bright-field images with indicated surfaces. (Bii) Platelet deposition (percent surface area coverage [SAC]). (Biii) Multilayered thrombus (percent SAC) on the collagen I surface. (Biv) Representative fluorescence images of P-selectin, integrin αIIbβ3 activation (JON/A), and PS exposure (Annexin V) from the collagen surface, and (Bv) percent SAC of fluorescence images. (Bvi) Heatmap of outcome parameters expressed as effect sizes per genotype76; P1, platelet deposition; P2, multilayered thrombus; P3, P-selectin; P4, JON/A; and P5, PS exposure from indicated surfaces. Scale bar represents 10 μm. Experiments and analysis were performed in a double-blinded manner. Percent SAC was analyzed using Fiji (n = 15 images from 5 mice per genotype). (C) Representative platelet aggregation and ATP secretion traces in response to the indicated agonists in (Ci-Cvi) washed platelets or (Cvii) ADP-sensitive washed platelets (n = 4-8 mice per condition per genotype). See also supplemental Figure 7. (Di) Representative differential interference contrast (DIC) microscopy images of resting (basal) and thrombin-stimulated (0.1 U/mL, 5 minutes) platelets spread on fibrinogen-coated coverslips (100 μg/mL, 45 minutes, 37°C; scale bar, 5 μm). (Dii) Mean surface area of individual platelets quantified by ImageJ (n = 256 platelets per condition per genotype). (E) Fibrin clot retraction was assessed 2 hours after the addition of 1 U/mL thrombin and 2 mM CaCl2 to platelet-rich plasma. Clot volumes were expressed as a percentage of the initial volume of platelet-rich plasma (n = 8 per genotype). *P < .05, **P < .01, ***P < .001; 2-way (Bii,Bv,D) or 1-way (A,Biii,E) ANOVA with Tukey’s test; data represent mean ± SEM.


