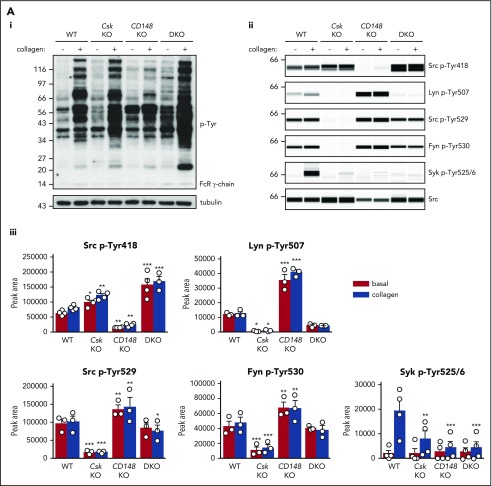
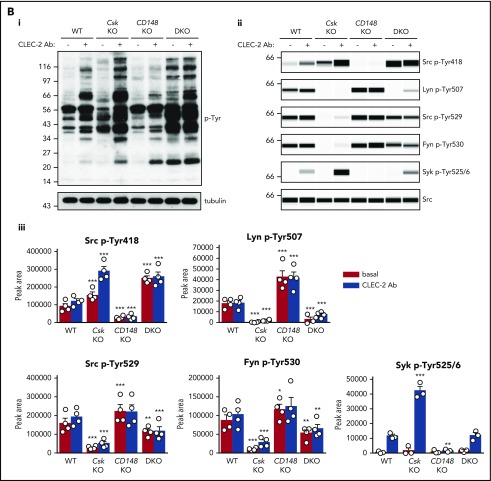
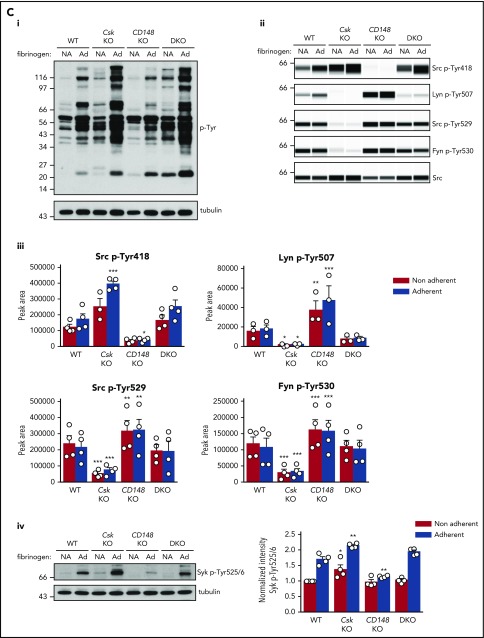
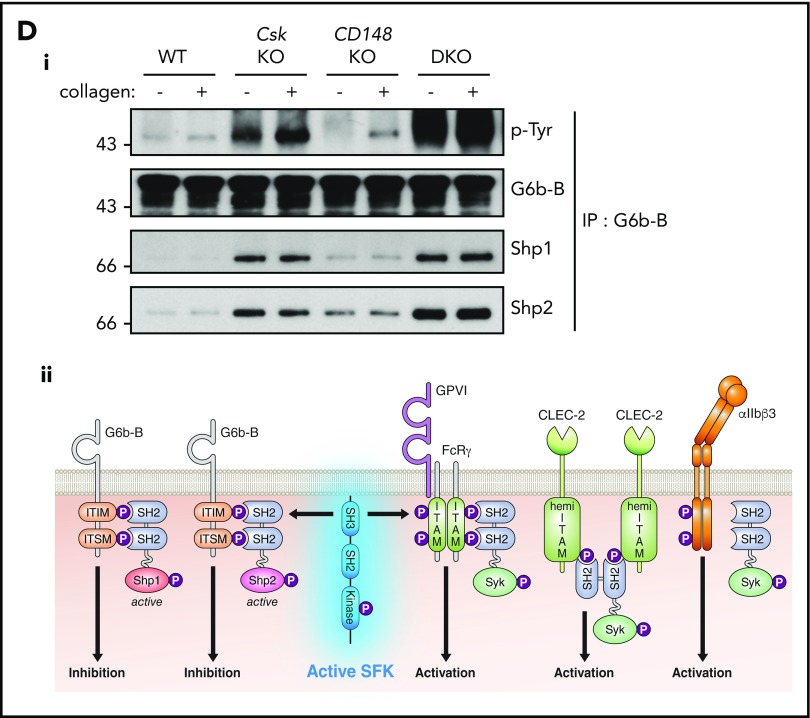
Figure 5.
Csk and CD148 are critical for platelet activation signals. (Ai) Lysates of basal and collagen-stimulated (30 μg/mL, 90 seconds) platelets were blotted for p-Tyr and tubulin. (Aii-iii) The same lysates were analyzed by capillary-based immunoassays with the indicated antibodies. Representative data displayed as blots in panel Aii. (Aiii) Quantification of peak areas from supplemental Figure 9A (n = 3-4 mice per genotype). See also supplemental Figure 9A. (B) Lysates of basal and CLEC-2 antibody–stimulated (10 μg/mL, 5 minutes) platelets were analyzed as described in panels Ai-Aiii (n = 3-4 mice per genotype). See also supplemental Figure 9B. (C) Lysates of nonadherent (NA) and adherent (Ad) platelets from fibrinogen-coated plates (100 μg/mL, 45 minutes, 37°C) were analyzed as described in panels Ai-Aiii. See also supplemental Figure 9C. (Civ) The same lysates were blotted for Syk p-Tyr525/6 (n = 3-4 mice per genotype). Differences in basal SFK p-Tyr418 between WT and DKO platelets in suspension (A-B) compared with nonadhered platelets (C) are due to differences in sample preparation, as demonstrated by a significant increase in Src p-Tyr418 levels in nonadhered platelets incubated on fibrinogen-coated surface (supplemental Figure 9D). (Di) Increased G6b-B phosphorylation and assembly of the G6b-B-Shp1-Shp2 complex in Csk KO and DKO platelets. Lysates of basal and collagen-stimulated (30 μg/mL, 90 seconds) platelets were immunoprecipitated with anti-G6b-B antibody and blotted for p-Tyr, G6b-B, Shp1, and Shp2. (Dii) The role of SFKs in activating and inhibitory pathways. Once a threshold level of SFK activity is reached, ITAM, hemi-ITAM, integrin, and ITIM signaling are triggered. The kinetics and order of activation depend upon the agonist and level of SFK activity. (Dii) Professional illustration by Patrick Lane, ScEYEnce Studios. *P < .05, **P < .01, ***P < .001; repeated-measures 2-way ANOVA with Tukey’s test; data represent mean ± SEM.


