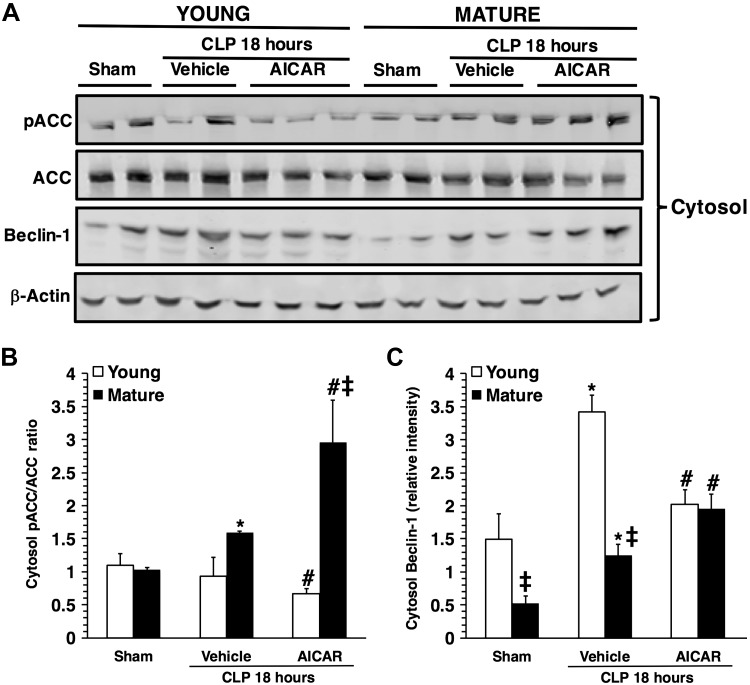
Figure 8.
A) Western blot analysis of pACC, ACC, beclin-1 and β-actin (used as the loading control) in liver cytosol extracts. Image analyses of pACC/ACC ratio (B) and beclin-1 expression (C), as determined by densitometry. Data are means ± sem of 4–6 animals for each group and are expressed as relative intensity units. Expression of pACC was normalized toward total ACC and β-actin. Expression of beclin-1 was normalized toward β-actin. *P < 0.05 vs. age-matched control mice; #P < 0.05 vs. vehicle-treated group of the same age; ‡P < 0.05 vs. young group.

