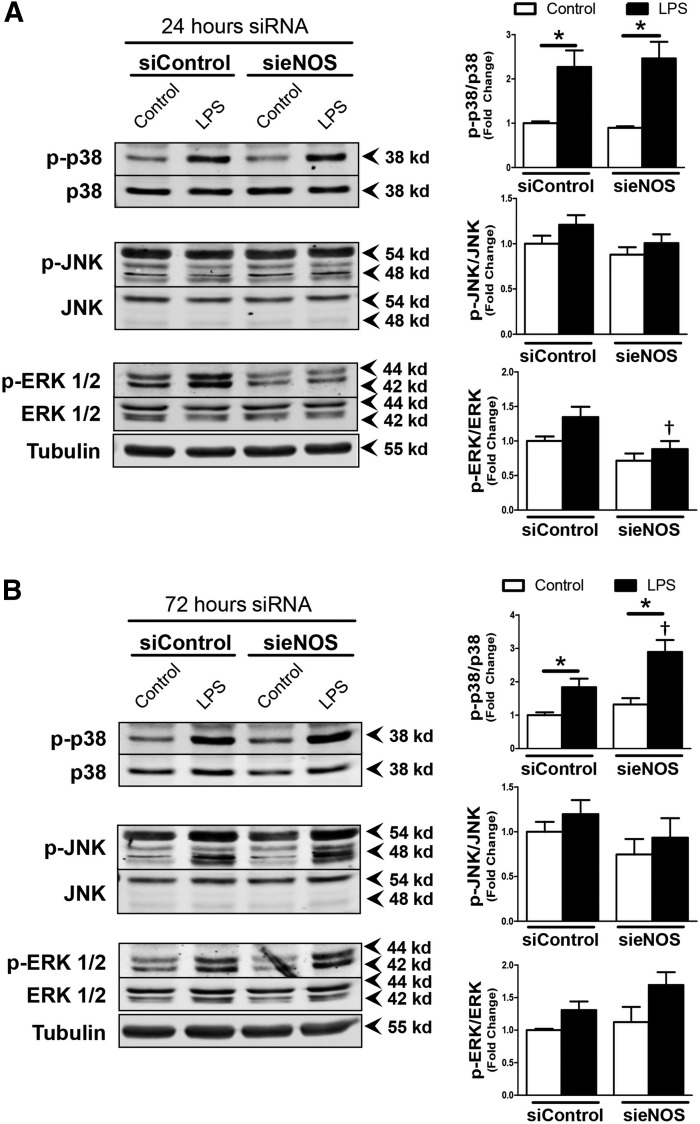
Figure 4.
p38 phosphorylation in response to LPS was enhanced by eNOS knockdown. A) Representative Western blot images of HMVECs exposed to siRNA (siControl or sieNOS) for 24 h and then treated with LPS (100 ng/ml) for 1 h (left). Images show band intensity for p-p38, p38, p-JNK, JNK, p-ERK1/2, ERK1/2, or α-tubulin with ratios of phosphorylated protein to respective total protein (right) B) Representative Western blot images of HMVECs exposed to siRNA (siControl or sieNOS) for 72 h (left) with 1 h of LPS and respective ratios of phosphorylated protein to associated total protein (right) (n = 6/group). *P < 0.05 between compared groups, †P < 0.05 between group compared to siControl.

