Figure 3.
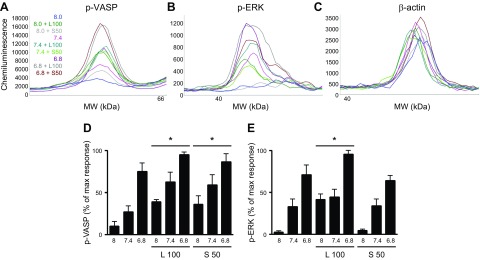
Induction of VASP or ERK phosphorylation by lorazepam and sulazepam in OGR1-expressing HEK293 cells. A–C) Representative electropherograms for p-VASP, p-ERK, and β-actin generated by capillary electrophoresis using ProteinSimple Wes. D, E) Data represent means ± sem values from 4 experiments. For p-VASP, a statistically significant (P < 0.05, ANOVA) treatment effect for lorazepam (L) and sulazepam (S) was observed. For p-ERK, a statistically significant treatment effect for lorazepam was observed. *P < 0.05 by 2-way ANOVA.

