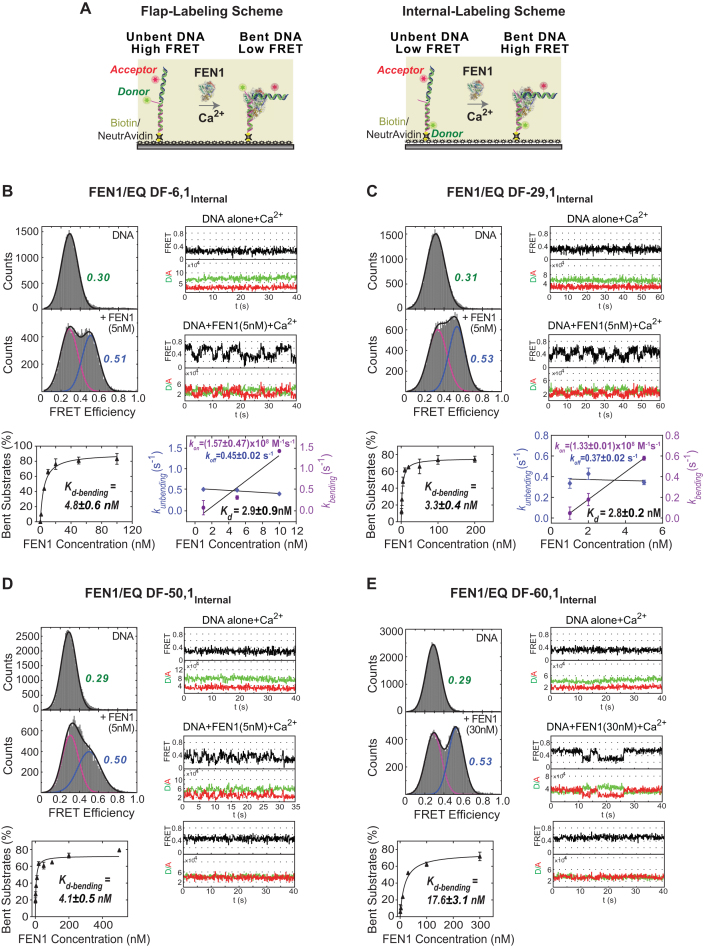
Figure 2.
Effect of 5′ flap length on FEN1 DNA bending activity. (A) Schematic of smFRET assay with two labeling schemes used to study FEN1 bending. The left panel shows the flap-labeling scheme with Cy3 donor at the end of 5′ flap and Alexa Fluor 647 acceptor in the upstream primer of the DF substrate; the FRET ratio decreases upon FEN1 binding and bending. The right panel shows the internal-labeling scheme where both donor and acceptor are in the template strand; the FRET ratio increases upon FEN1 binding and bending. (B) FEN1 bending efficiency of internally labeled EQ DF-6,1 (EQ DF-6,1Internal). Top left panel shows smFRET histograms of EQ DF-6,1Internal alone and upon addition of 5 nM FEN1. The histograms were fitted by one or two Gaussian distributions for DNA-only and DNA + FEN1, respectively. In the DNA + FEN1 histogram, the fitted unbent peak (shown in magenta) has same FRET center as DNA-only, and the fitted bent peak is shown in blue. Top right panel shows representative single molecule time traces of EQ DF-6,1Internal alone and upon addition of 5 nM FEN1. Bottom left panel is an isotherm of percentage of bent substrate (%) versus FEN1 concentration (nM). The percentage of bent substrates was estimated by the Gaussian-fitted bent peak for three replicates at each FEN1 concentration. The isotherm was fitted to a one-site binding model with Bmax ≤ 100 and yielded the DNA bending dissociation constant (Kd-bending). Error bars reflect variation of the % bent substrate from the three replicates and the reported error is the error of the fit. Bottom right panel shows a graph of kbending (s−1) and kunbending (s−1) versus FEN1 concentrations (nM). At each FEN1 concentration, time traces were idealized and fit by vbFRET to calculate the dwell times τbending and τunbending spent in the bent and unbent states, respectively. The histograms from the population of the dwell times were fit to exponential functions yielding kbending (1/τbending) and kunbending (1/τunbending). The association rate constant (kon-bending) was calculated from the slope of the linear regression fit of kbending versus FEN1 concentration. The dissociation rate constant (koff-unbending) was calculated as the mean of kunbending. The error bars correspond to the standard error of the exponential fit of kbending and kunbending and the errors reported for the association/dissociation constants correspond to the error of the fit and the standard error of the mean, respectively. Kd-bending = koff-unbending/kon-bending. (C) FEN1 bending efficiency of EQ DF-29,1Internal as described in B. (D) FEN1 bending efficiency of EQ DF-50,1Internal as described in B. (E) FEN1 bending efficiency of EQ DF-60,1Internal as described in B.

