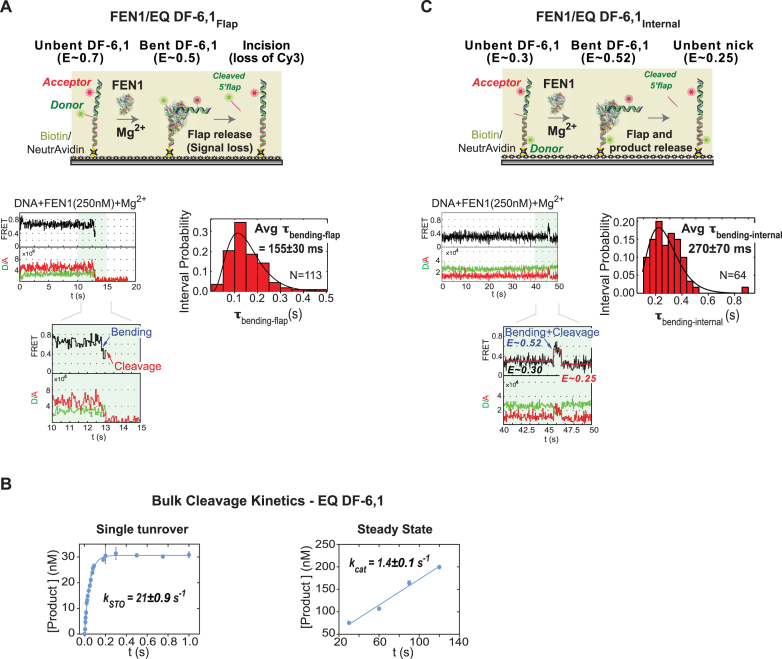
Figure 3.
Single molecule and bulk cleavage kinetics of FEN1 on short DF-substrates. (A) Flap-labeling smFRET cleavage assay. Top: schematic of the assay. EQ DF-6,1Flap is labeled as described in Figure 2A. In the presence of Mg2+, FEN1 binds and bends EQ DF-6,1Flap, decreasing FRET from ∼0.7 to ∼0.5. Upon cleavage, the Cy3-labeled flap is released and the signal is lost. The assay follows the time spent by DNA in bent state before loss of signal. Bottom left: a representative single molecule time trace showing FEN1 bending and cleaving the substrate before the 5′ flap is released; the inset zooms in on the cleavage event preceded by a brief bending step showing clear anti-correlation between donor and acceptor intensities. Bottom right: distribution of the dwell times spent in bent state (τbending-flap) for N = 113 cleavage events fitted to a gamma distribution. The average τbending-flap is reported with the standard error of the mean. The cleavage reaction was performed at 50 ms temporal resolution. More representative traces are shown in Supplementary Figure S1B. (B) Ensemble cleavage kinetics of FEN1 on EQ-DF6,1. Left: single turnover cleavage was measured on a rapid quench-flow instrument at a FEN1:DNA ratio of 35:1. The amount of 5′ flap product formed was analyzed by denaturing PAGE. Average product concentration from two replicates was plotted versus time and fitted to a single exponential equation to determine the cleavage rate (kSTO). Right: steady state cleavage was measured with FEN1:DNA at a ratio of 1:800. Average data from two replicates fitted to a linear regression yielded kcat (slope/[FEN1]). Error bars correspond to the variation of the two replicates, and the error of the fit is reported. (C) Internal-labeling smFRET cleavage assay. Top: schematic of the assay. EQ DF-6,1Internal is labeled as described in Figure 2A. In the presence of Mg2+, FEN1 binds and bends EQ DF-6,1Internal, increasing FRET from 0.3 to 0.52. Upon cleavage, the 5′ flap is released and a nicked duplex is generated, which has a FRET of 0.25 when unbent (Supplementary Figure S1A). The assay follows the time spent by DNA in bent state (0.52) before the product achieves unbent state. Bottom left: a representative single molecule time trace showing FEN1 bending and cleaving the substrate before FRET drops to 0.25; the inset zooms in on a vbFRET-fitted version of the cleavage event showing a three-state fit (0.3, 0.52 and 0.25) corresponding to the three DNA conformers, unbent EQ DF-6,1Internal, bent EQ DF-6,1Internal and unbent nicked product, respectively. Bottom right: distribution of the dwell times spent in bent state (τbending-internal) for N = 64 cleavage events fitted to a gamma distribution. The average τbending-internal is reported with the standard error of the mean. The cleavage reaction was performed at 50 ms temporal resolution. More representative traces are shown in Supplementary Figure S1C.

