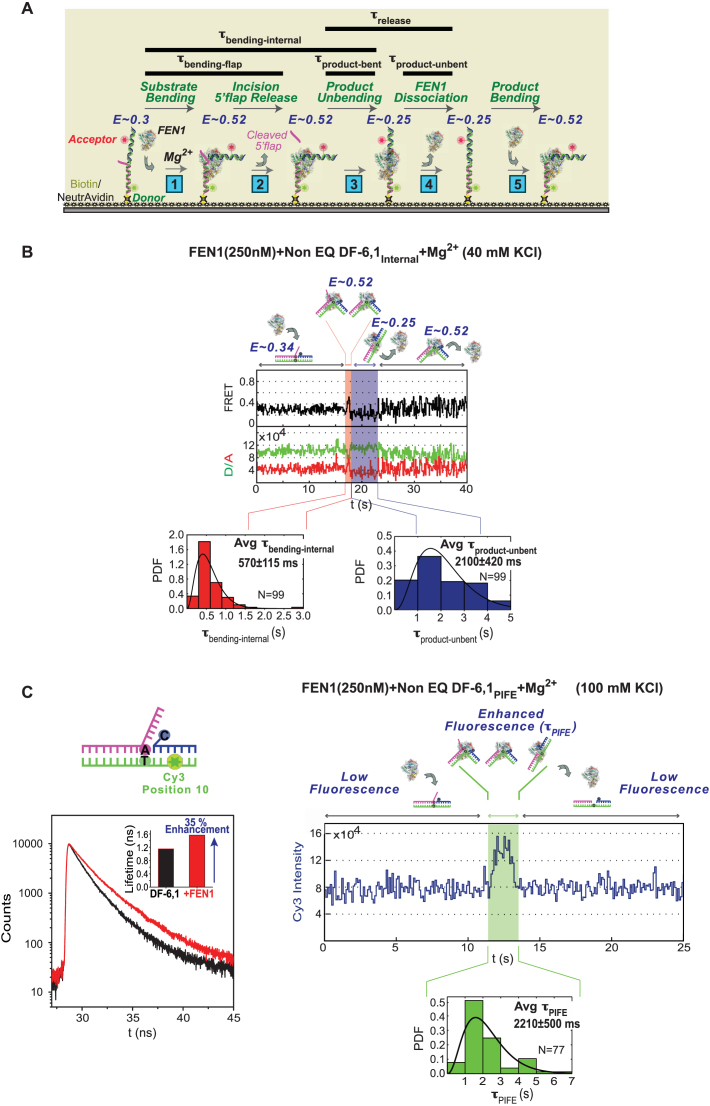
Figure 4.
Kinetic scheme for short 5′ flap recognition and cleavage by FEN1. (A) Schematic of the multi-step FEN1 reaction as revealed by the internal-labeling scheme: (1) Substrate bending: the extended DF substrate exhibits FRET of 0.3, which increases to 0.52 upon FEN1 binding and bending. (2) Incision/5′ flap release: FEN1 incises the 5′ flap 1 nt inside the junction, and the flap is instantaneously released (8); at this stage the FRET is 0.52. The time spent by the substrate in bent state just before 5′ flap release is accessed by the flap-labeling cleavage assay (τbending-flap). (3) Product unbending: the nicked duplex product remains bound and bent by FEN1 at a FRET of 0.52 (similar to that of bent substrate) before unbending to FRET ∼0.25. The time spent by the product in bent state (τproduct-bent) is the difference between the bent state dwell times in the internal-labeling (τbending-internal) and flap-labeling (τbending-flap) assays. (4) FEN1 dissociation: FEN1 remains bound to the unbent product (E ∼0.25) for some time (τproduct-unbent) before dissociating into solution. Thus, product release occurs in two steps and τrelease is the sum of τproduct-bent and τproduct-unbent. (5) Product bending: FEN1 can rebind/rebend the product again; hence, FRET fluctuates between 0.25 (unbent product) and 0.52 (bent product) at the end of the reaction. The rebinding step is detected by lowering KCl from 100 to 40 mM to increase FEN1 affinity for nicked DNA (Supplementary Figure S2B). (B) smFRET cleavage of non-EQ DF-6,1Internal. Top: representative single molecule time trace showing cleavage of DF-6,1Internal and exhibiting the substrate and product dynamics described in (A). The FRET state and the substrate/product conformer in each step is illustrated. τbending-internal is highlighted in red and τproduct-unbent is highlighted in blue on the time trace. The distributions of τbending-internal (bottom left) and τproduct-unbent (bottom right) for N = 99 cleavage events were fitted to gamma distributions, and the means with standard errors are reported. The cleavage reaction was performed at 100 ms temporal resolution. More representative traces are shown in Supplementary Figure S2E. (C) Bulk and single molecule PIFE experiments. Left: bulk time-resolved fluorescence lifetime measurements of non-EQ DF-6,1PIFE in the absence (black curve) and presence (red curve) of 1 μM FEN1. Inset shows the quantification of fluorescence lifetime in the absence and presence of FEN1. As described in ‘Materials and Methods’ section, the lifetimes are determined using a 2-exponential decay fit and show 35% fluorescence enhancement with FEN1. Right: representative time trace showing a smPIFE cleavage experiment with non-EQ DF-6,1PIFE. The substrate/product conformer in each state is illustrated. The time spent in the enhanced-fluorescence state τPIFE is highlighted in green. The distribution of τPIFE for N = 77 cleavage events was fitted to gamma distribution, with the mean and standard error of the mean reported. The cleavage reaction was performed at 100 ms temporal resolution. Additional traces are shown in Supplementary Figure S2F.

