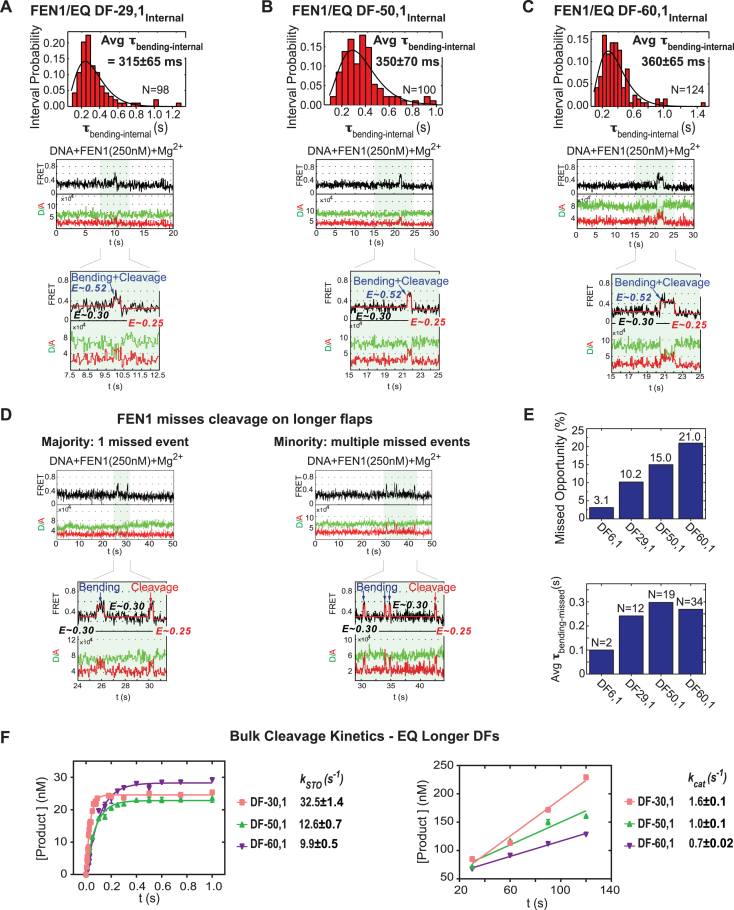
Figure 6.
Effect of 5′ flap length on FEN1 cleavage activity. (A) smFRET cleavage of EQ DF-29,1Internal. Top: distribution of the dwell times spent in bent state (τbending-internal) for N = 98 cleavage events fitted to a gamma distribution. Average τbending-internal is reported with the standard error of the mean. Bottom: a representative single molecule time trace showing FEN1 bending and cleaving the substrate before FRET drops to 0.25; the inset zooms in on a vbFRET-fitted version of the cleavage event showing a three-state fit (0.3, 0.52 and 0.25) corresponding to the three DNA conformers, unbent DF-29,1Internal, bent DF-29,1Internal and unbent nicked product. The cleavage reaction was performed at 50 ms temporal resolution. More representative traces are shown in Supplementary Figure S3A. (B) smFRET cleavage of EQ DF-50,1Internal as described in (A). More representative traces are shown in Supplementary Figure S3B. (C) smFRET cleavage of EQ DF-60,1Internal as described in (A). More representative traces are shown in Supplementary Figure S3C. (D) FEN1 misses cleavage on longer DF substrates. FEN1 almost always cleaves a short-flap substrate (EQ DF-6,1Internal) in the first bending event (8). With longer flaps, FEN1 exhibits missed opportunities at cleavage (defined as an unproductive bending event wherein FRET drops to unbent substrate state (0.3) rather than unbent product state (0.25)). Representative single molecule time traces show a majority of these events are single missed opportunities (left) and a minority are multiple missed opportunities (right). Insets zoom in on vbFRET-fitted versions of the missed events as well as the cleavage events with three-state fits. The fits show FRET returning to the substrate unbent state (0.3) in missed events and dropping to the product unbent state (0.25) in cleavage events. More representative traces are shown in Supplementary Figure S3D. (E) Quantification of missed cleavage events. Top: a bar chart shows that the percentage of particles exhibiting cleavage with missed opportunities increases with flap length from 3.1% (DF-6,1) to 21.0% (DF-60,1). Bottom: a bar chart shows the average time spent in bent state during missed events (τbending-missed) by the different DF substrates. The reported N is the number of missed events, not number of particles, accounting for particles with multiple missed events. (F) Ensemble cleavage kinetics of FEN1 on longer flap EQ DF substrates. Left: single turnover cleavage of DF-30,1, DF-50,1 and DF-60,1. Right: steady state cleavage of DF-30,1, DF-50,1 and DF-60,1. The rates were measured and reported as described in Figure 3B.

