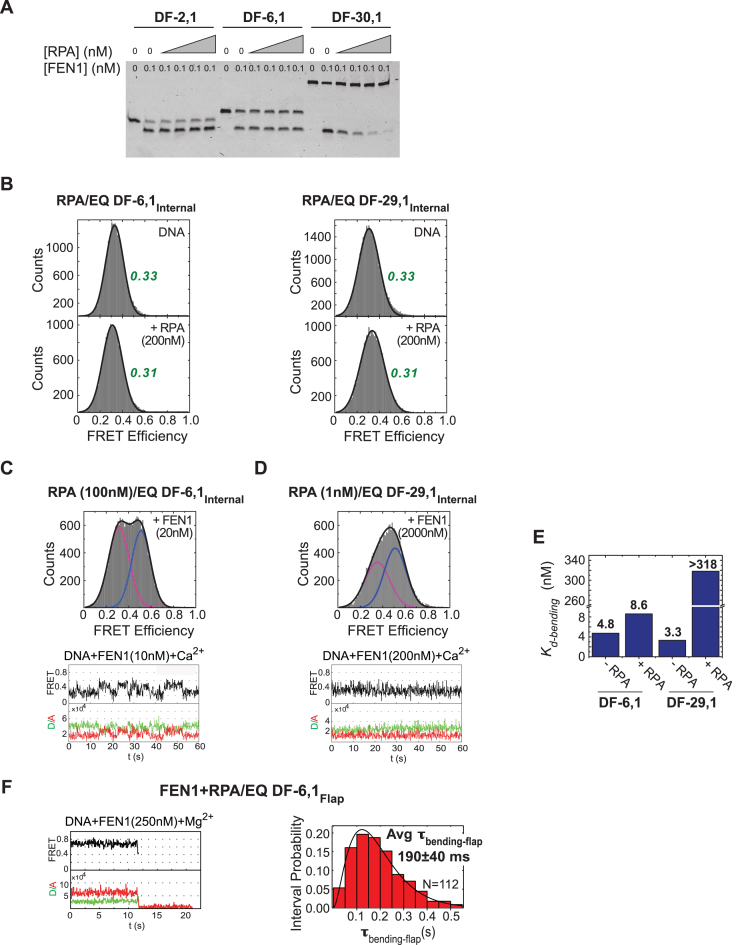
Figure 7.
Coordination between FEN1 and RPA actions on short- and long-flap substrates. (A) Steady state FEN1 cleavage activity in the presence of RPA. Gel showing short- and long-flap substrates cleaved by FEN1 in the presence of increasing RPA (0–5 nM). While RPA has no effect in the case of short flaps (DF-2,1 and DF-6,1), it inhibits FEN1 activity on DF-30,1 in a concentration-dependent manner. (B) RPA shows no effect on the structure, and thus the FRET, of EQ DF-6,1Internal and EQ DF-29,1Internal. Left: EQ DF-6,1Internal DNA-only histogram (top) with FRET centered around 0.33, and upon addition of 200 nM RPA (bottom) with FRET centered around 0.31. Right: corresponding histograms for EQ DF-29,1Internal substrate. (C) smFRET bending of EQ DF-6,1Internal by FEN1 in the presence of 100 nM RPA. Top: histogram showing distribution of FRET states upon addition of 20 nM FEN1 (unbent peak shown in magenta, bent peak shown in blue). The peaks are well separated and centered around the same FRET values as in the absence of RPA (Figure 2B). Bottom: a representative single molecule time trace showing similar transitioning rates between bent and unbent states as seen without RPA. (D) smFRET bending of EQ DF-29,1Internal by FEN1 in the presence of 1 nM RPA. Top: histogram showing distribution of FRET states upon addition of 2000 nM FEN1. The peaks (unbent in magenta, bent in blue) are merged and the centers are shifted from those seen in the absence of RPA (Figure 2C). Bottom: a representative single molecule time trace showing fast transitions between bent and unbent states that cannot be resolved within the temporal resolution of acquisition (100 ms). With such fast transitions, the FRET state captured within each frame (100 ms period) is an average and not a true FRET state. This averaging explains why the traces do not show distinct FRET states, and why the full bending (0.5) state is not reached. This effect appears as merging of the peaks in the histograms. Therefore, at any particular concentration, the percentage of the bent peak is underestimated, and consequently the Kd-bending as well. (E) A bar chart illustrating RPA effect on FEN1 Kd-bending. RPA has no effect on the Kd-bending of FEN1 for DF-6,1, but increases Kd-bending by >100-fold for DF-29,1 (note that this value is a lower estimate, due to the averaging effect noted above, given that the bent state does not saturate even at 2000 nM FEN1; panel D). (F) smFRET cleavage in the presence of RPA. FEN1 cleavage efficiency on EQ DF-6,1Flap was assayed in the presence of 100 nM RPA and at 50 ms temporal resolution. Left: single molecule time trace showing cleavage wherein a brief bending event is followed by loss of signal due to flap release. Right: the distribution of τbending-flap for N = 112 cleavage events in the presence of RPA was fitted with a gamma distribution and the mean with standard error is reported. More representative traces are shown in Supplementary Figure S4A.

