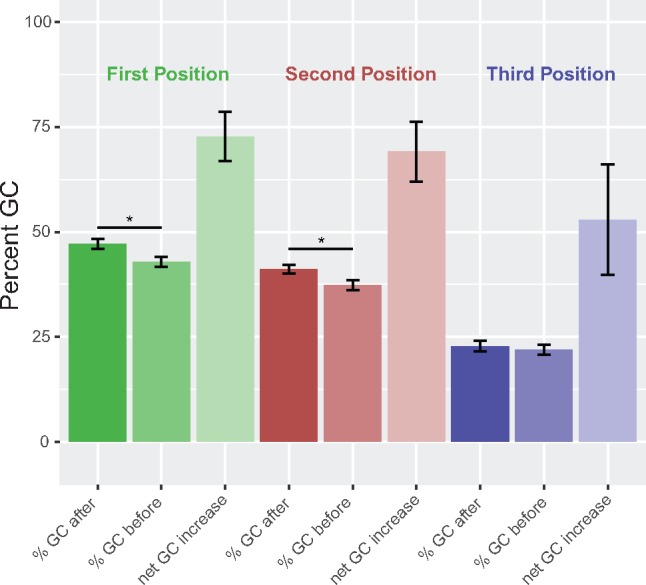
Fig. 2.

—Effect of editing on GC content. This figure shows the inherent GC content bias among codon positions in dinoflagellates, with higher GC content in positions one and two, and the effect of editing to increase GC content significantly in positions one and two, but not three. Bars are color-coded by codon position. Net GC increase defined as the difference between GC-enriching (i.e., A or T to G or C) and GC-depleting edits. Error bars denote 95% confidence intervals.
