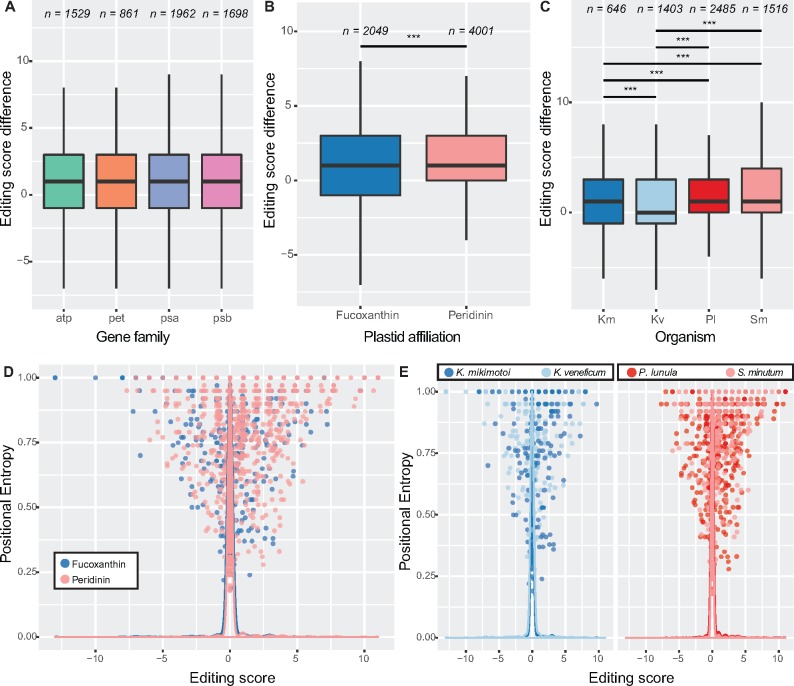
Fig. 8.
—Editing functions vary across genes and lineages. This figure shows how, despite that editing is corrective overall, this corrective effect varies across organisms and that noncorrective events occur in variable and conserved positions. Separate boxplots show editing scores of all sites between genes (A), plastid types (B), and by organism (C); n denotes sample size (number of events). (D) Scatter plot showing the relationship between positional entropy of edited positions and the effect of editing events, as assessed by average editing score. Lines represent density of values for clarity. Note not only that the plot is skewed toward positive editing score values but also that a number of noncorrective events exist, including in highly (i.e., entropy > 0.90) conserved positions. (E) Plot as in (D), but focussing on individual organisms. Significance is denoted: *P value < 0.05, **P value < 0.01, ***P value < 0.001. Abbreviations: Km, Karenia mikimotoi; Kv, Karlodinium veneficum; Pl, Pyrocystis lunula; Sm, Symbiodinium minutum.

