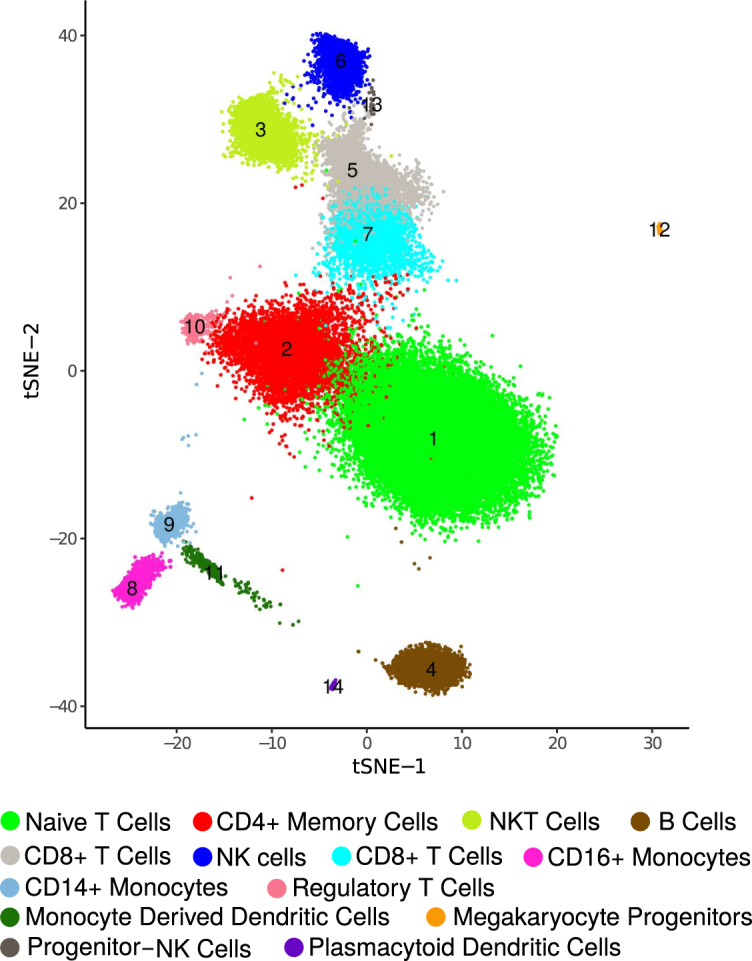
Figure 5.

Clustering of ∼68K PBMC data. dropClust based visualization (a modified version of tSNE) of the transcriptomes. Fourteen clusters, retrieved by the algorithm are marked with their respective cluster IDs. Legends show the names of the inferred cell types.
