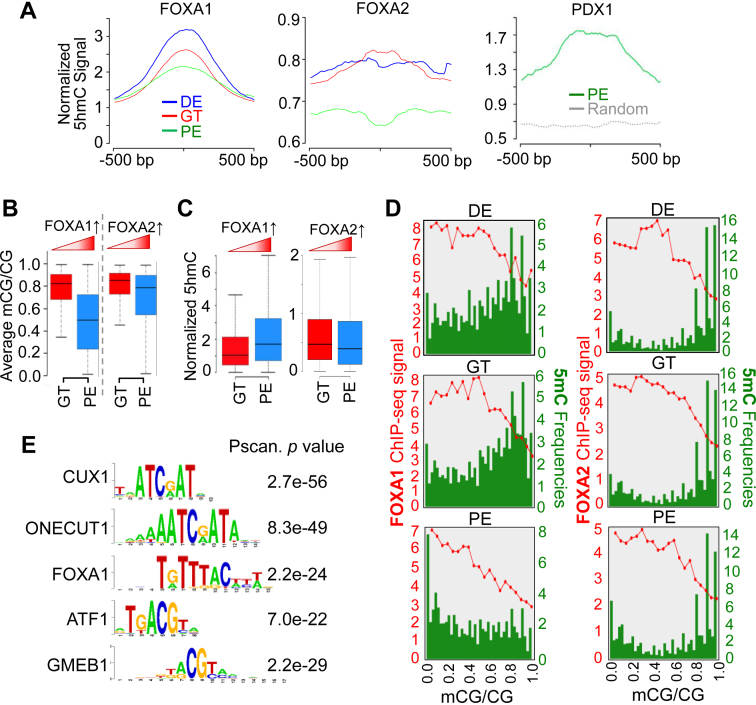
Figure 5.
Dynamic DNA methylation alterations are selectively associated with the binding of key TFs during ES-to-PE differentiation. (A) Normalized 5hmC signals plotted according to the clustered peaks (500 bp up- or downstream) of FOXA1 (left), FOXA2 (middle) and PDX1 (right) binding sites at DE (blue), GT (red) and PE (green) stages. (B and C) Average 5mC signals (B) and normalized 5hmC signals (C) at enhancers that exhibited increased FOXA1 (left) or FOXA2 (right) binding during GT-to-PE differentiation. Enhanced FOXA1 binding to the genome was correlated with reduced DNA methylation and increased 5hmC. Such correlation was not observed between FOXA2 binding and 5mC/ 5hmC. (D) Quantification of DNA methylation levels (green) within FOXA1 or FOXA2 binding sites (revealed by ChIP-seq intensities; red) at the indicated pancreatic differentiation stages. Green bars represent the frequencies of CpGs sites in FOXA1 or FOXA2 binding sites (at 5% methylation ratio intervals). Red curves indicate FOAX1 or FOXA2 ChIP-seq signals within the corresponding methylation intervals. (E) Identification of key TF binding motifs within 5hmC enriched regions at the PE stage by the Pscan software (55).

