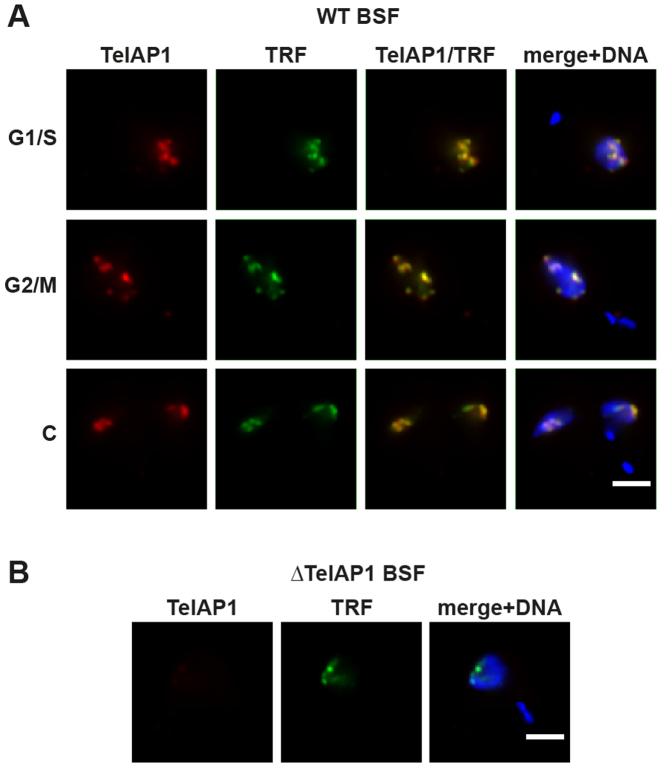
Figure 2.
TelAP1 co-localizes with TbTRF in the nucleus of BSF cells. (A) Indirect immunofluorescence analysis (IFA) of BSF cells in different cell cycle stages as indicated using monoclonal antibodies specific for TelAP1 (red) and TbTRF (green). (B) Indirect IFA of ΔTelAP1 BSF cells confirmed the specificity of the TelAP1 signal. DNA was stained with Hoechst (blue). Scale bar 2 μm. S/G1 (synthesis/Gap1 phase), G2/M (Gap2 phase/mitosis), C (cytokinesis).

