Figure 4.
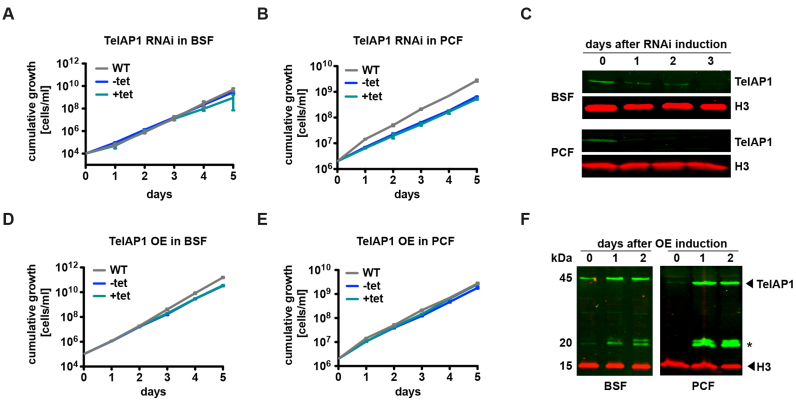
Cell viability of both life cycle stages is independent of TelAP1 protein expression levels. (A) Cumulative growth of WT, non-induced (−tet) and induced (+tet) TelAP1 RNAi BSF cell lines. (B) Cumulative growth of TelAP1-depleted PCF cells. (C) Western blot analysis confirmed TelAP1 depletion in BSF and PCF cells. Histone H3 was used as loading control. (D) Cumulative growth of BSF and (E) PCF cells after induction of ectopic TelAP1 overexpression. (F) Western blot analysis of TelAP1 overexpression. Two additional bands (asterisk) are detectable after overexpression. Histone H3 was used as loading control. All growth curves represent the cumulative mean cell number ± SD of three biological replicates of one clone.

