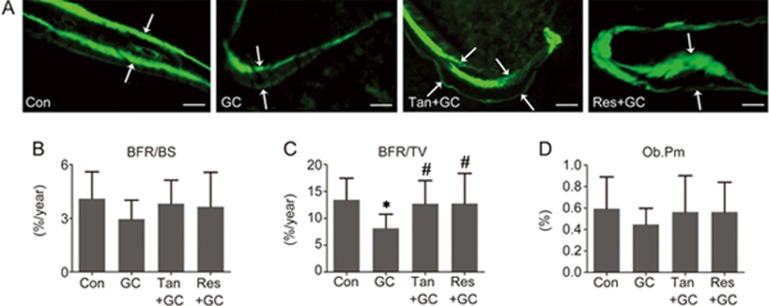
Figure 4.
Tanshinol hampers the decreased bone formation induced by glucocorticoid. (A) Representative fluorescence micrographs of the tibia of rats showing the bone formation capacity detected with a dual calcein labeling assay. Bars: 100 μm. (B and C) The dynamic parameters of the rate of bone formation were determined by histomorphometry. (D) The statistical parameter of the osteoblast-lined bone surface was related to the activity of bone formation. The data are presented as the mean±SD (n=8). *P<0.05 vs normal control (Con). #P<0.05 vs GC treatment (GC).

