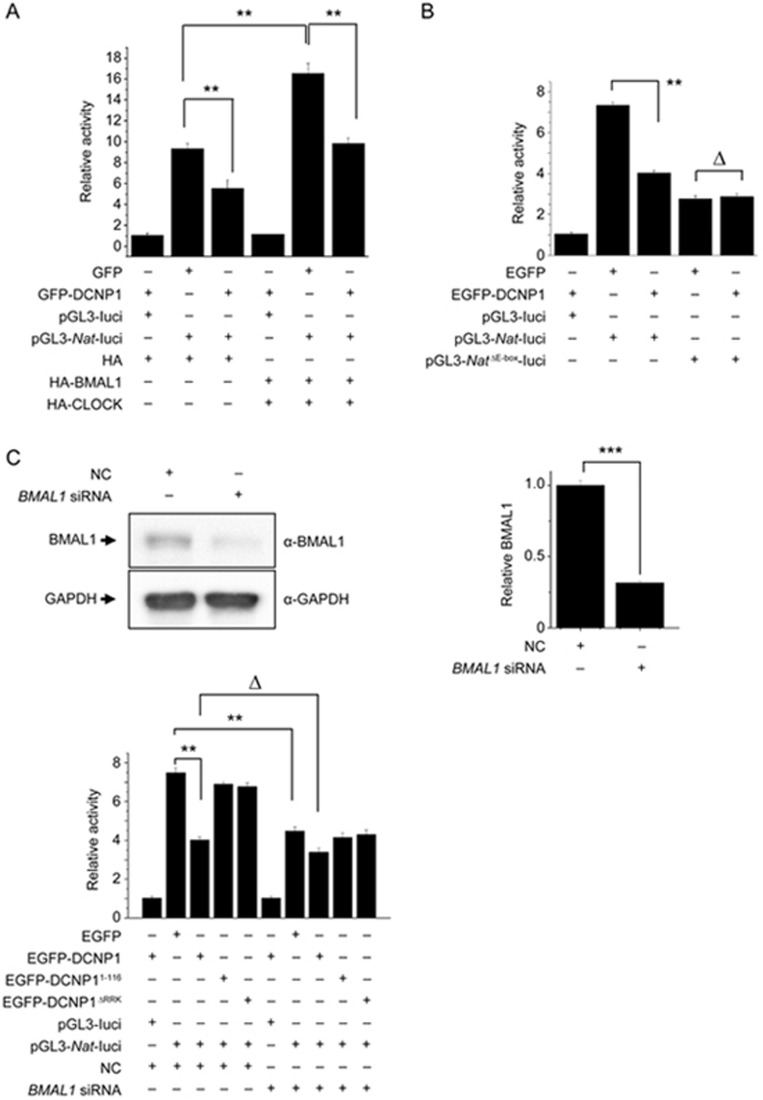
Figure 5.
DCNP1 regulates Nat promoter activity through BMAL1. (A) HEK293 cells were co-transfected with equal amounts (400 ng) of a Nat promoter construct and luciferase reporter, along with plasmids that expressed EGFP, EGFP-DCNP1, HA or HA-BMAL1/HA-CLOCK. Forty-eight hours later, the luciferase activities were quantified and relative ratios were calculated. The data shown are the mean±SEM of three independent experiments. **P<0.01, two-way ANOVA. (B) HEK293 cells were co-transfected with equal amounts (400 ng) of a Nat promoter luciferase reporter construct or an E-box deletion construct along with plasmids that expressed EGFP or EGFP-DCNP1. Forty-eight hours later, the luciferase activities were quantified and relative ratios were calculated. The values are the mean±SEM of three independent experiments. **P<0.01, ΔP>0.05, two-way ANOVA, followed by the t-test. (C) RNA oligonucleotides against BMAL1 (BMAL1 siRNA) or negative control (NC) were transfected into HEK293 cells. Seventy-two hours later, cells were harvested and subjected to immunoblot analysis. The BMAL1 protein levels were quantified relative to GAPDH. The values are the mean±SEM of three independent experiments. ***P<0.001, t-test. (D) HEK293 cells were treated with NC or BMAL1 siRNA. Then cells were co-transfected with equal amounts (400 ng) of a Nat promoter luciferase reporter construct along with plasmids that expressed EGFP, EGFP-DCNP1, EGFP-DCNP11-116 or EGFP-DCNP1ΔRRK. Forty-eight hours later, the luciferase activities were quantified and relative ratios were calculated. The data shown are the mean±SEM of three independent experiments. **P<0.01, ΔP>0.05, two-way ANOVA followed by t-test.

