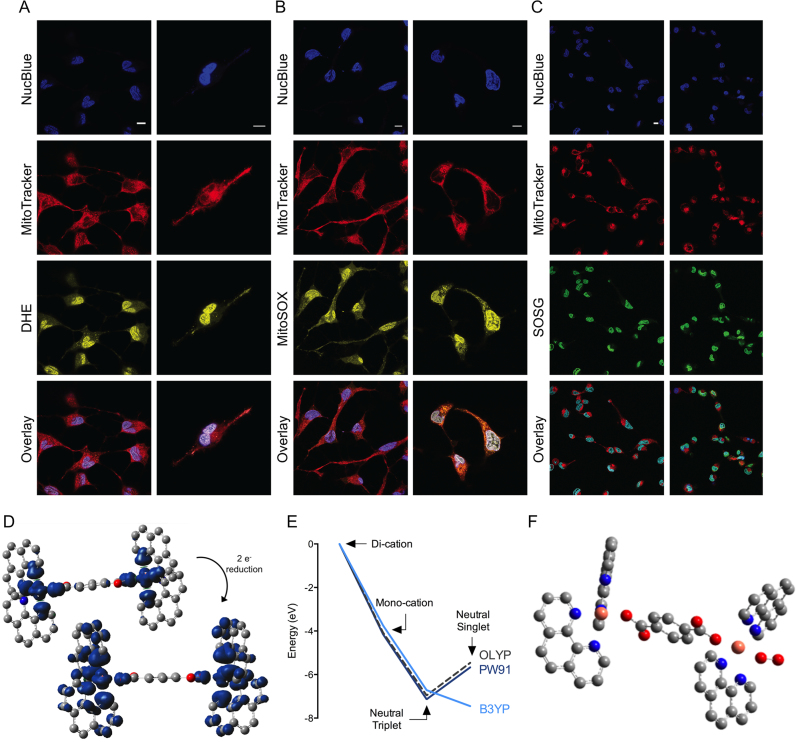
Figure 4.
Confocal images of intracellular ROS generated by Cu-Terph (0.5/1.0 μM) collected with 63 × water immersion objective. SKOV3 nuclei were stained with NucBlue Live, mitochondria with MitoTracker Deep Red and selective detection of ROS with fluorogenic probes DHE for nuclear superoxide (DHE, A), mitoSOX red for MitoSOX (B) and SOSG (C). Scale bars indicate 10 μm, D. Spin density maps upon reduction of Cu-Terph2+ to Cu-Terph0. (E) Energies of trans-Cu-Terphn+ (n = 2, 1 and 0) relative to the di-cationic complex set at 0 eV for each functional and (F) molecular structure of the oxygen adduct of triplet Cu-Terph0.

