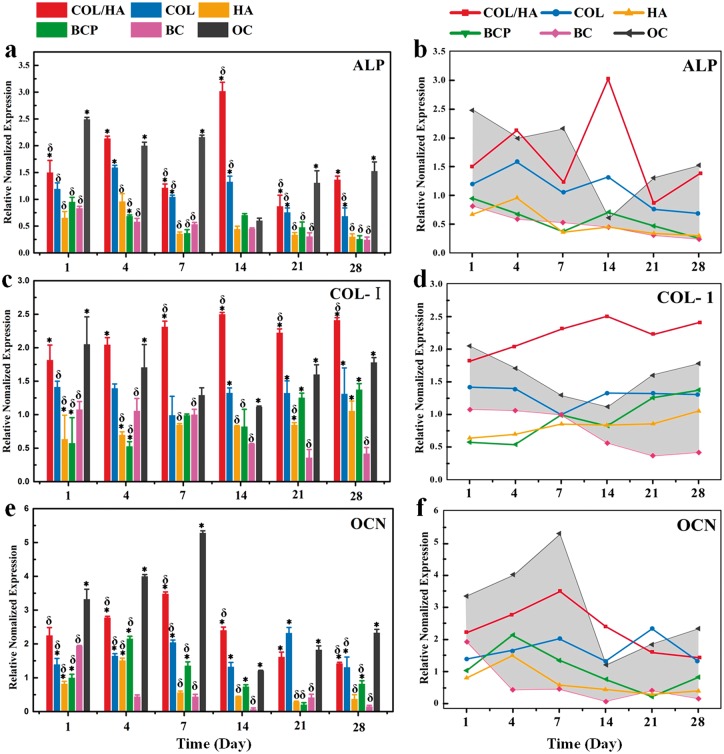
Figure 9.
Expression of osteogenic genes for rat BMSCs after culturing for 1, 4, 7, 14, 21 and 28 days onto four groups of materials (COL/HA, COL, HA, BCP) as well as coverslips as two groups of controls (BC, OC), including (a, b) ALP, (c, d) COL-I and (e, f) OCN. In the line charts of (b), (d) and (f), the shadow area as a reference model is delimited between the data of OC (the upper line) and BC, facilitating to compare the expression level of osteogenic gene of cells on different materials. * refers to P < 0.05 compared with BC group, δ refers to P < 0.05 compared with OC group

